


A popular tourist destination experiences regular coastal flooding and erosion
Encounter Bay is a coastal suburb near Victor Harbor, South Australia, a well-known tourist destination with essential local infrastructure, including a boat ramp, car park, and shared pathways. The area supports a mix of residential, commercial, and recreational spaces, making it a key community hub.
The region’s population increases significantly during peak holiday periods driven by holiday home visitors, short-term accommodation stays, and day-trippers from Adelaide and surrounds. The seasonal influx places additional pressure on infrastructure, roads, coastal pathways, and public facilities, reinforcing the need for robust coastal protection measures to safeguard key community assets year-round.
Encounter Bay is highly vulnerable to coastal flooding and erosion, challenges that are expected to intensify with rising sea levels and more frequent extreme weather events. The existing shoreline configuration – that includes a public beach, the Encounter Bikeway, Franklin Parade, and adjacent residential and commercial properties – already experiences impacts from overtopping and erosion.
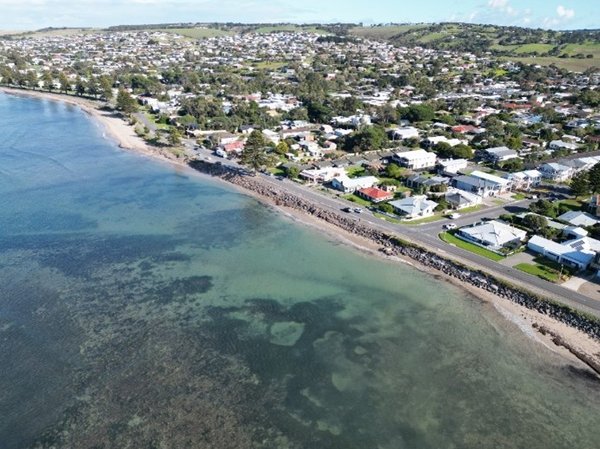
Figure 1a: Encounter Bay; Charles St to Fell St
- © Magryn & Associates Pty LtdEncounter bay Fig 1

Figure 1a: Encounter Bay; Charles St to Fell St
© Magryn & Associates Pty Ltd
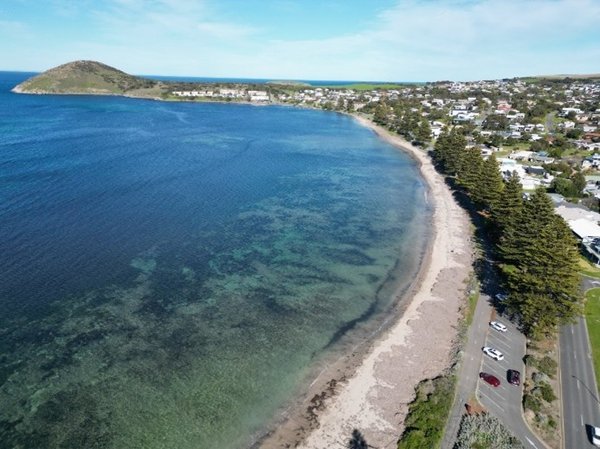
Figure 1b: Encounter Bay; Fell St to boat ramp
- © Magryn & Associates Pty LtdEncounter bay Fig 1b

Figure 1b: Encounter Bay; Fell St to boat ramp
© Magryn & Associates Pty Ltd
Sections of the coast along the study area regularly experience wave overtopping, leading to:
- accumulation of seaweed and debris on the Bikeway/road
- blockages in stormwater drains after storm events, leading to road flooding
- erosion of the landward side of the existing seawall.
These issues present ongoing maintenance challenges for the local council and pose long-term risks to public infrastructure and private properties.
Severe storm surge/swell events has resulted in overtopping and also caused significant erosion of the shoreline and lowering of the beach (reducing beach width and public amenity). In response to these urgent erosion concerns, the Council undertook emergency protection works in 2023 to stabilise some sections and prevent further damage to infrastructure and community assets.
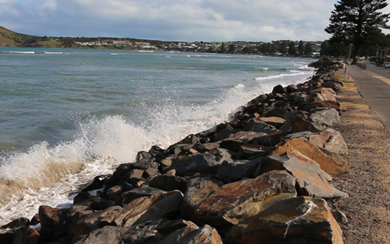
Figure 2: Wave action during routine swell event.
- © Magryn & Associates Pty LtdEncounter Bay Fig 2

Figure 2: Wave action during routine swell event.
© Magryn & Associates Pty Ltd
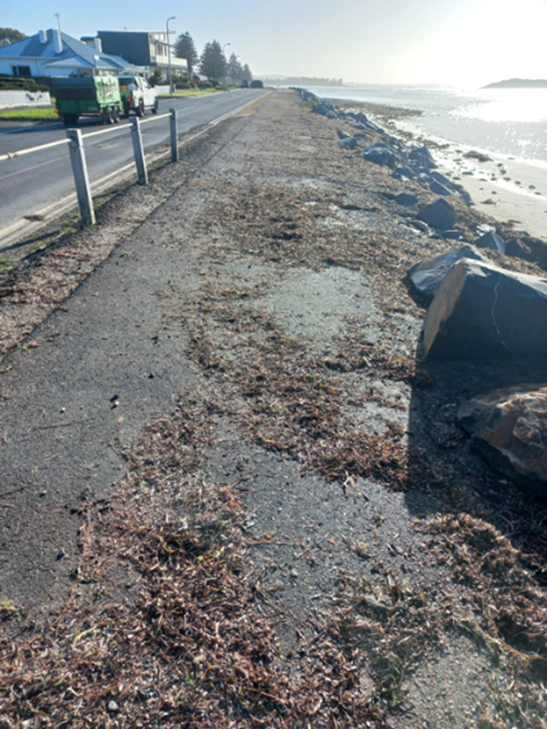
Figure 3a: Overtopping implications, erosion and seaweed on the bikepath 2024.
- © City of Victor HarbourEncounter Bay Figure 3a

Figure 3a: Overtopping implications, erosion and seaweed on the bikepath 2024.
© City of Victor Harbour
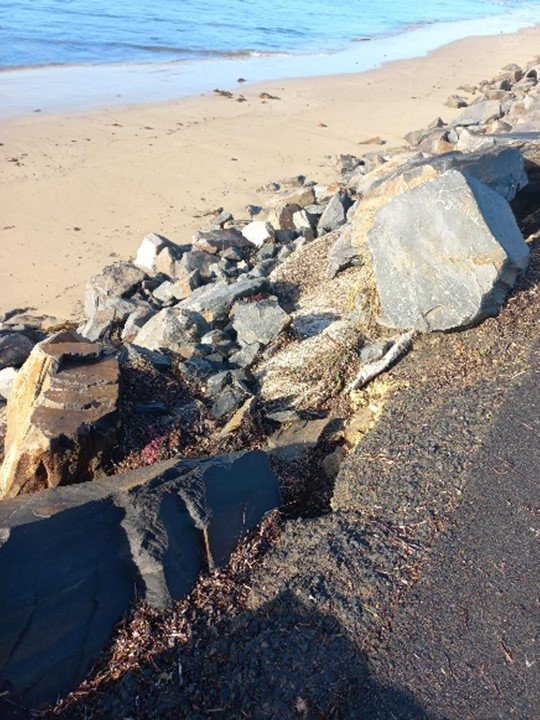
Figure 3b: Overtopping implications, erosion and seaweed on the road 2024.
- © City of Victor HarbourEncounter bay Fig 3b

Figure 3b: Overtopping implications, erosion and seaweed on the road 2024.
© City of Victor Harbour

Figure 4: Erosion scarp from 2024 storm event.
- © Magryn & Associates Pty LtdEncounter bay Fig 4
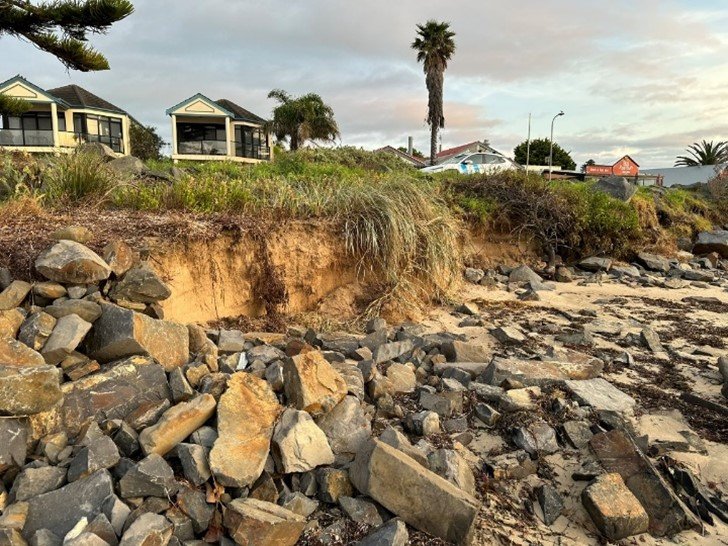
Figure 4: Erosion scarp from 2024 storm event.
© Magryn & Associates Pty Ltd
The Coastal Adaptation Strategy
The Coastal Adaptation Study (undertaken previously by Integrated Coasts with input from Magryn) considered the 1.6km of coastline as two segments to be designed and implemented in stages based on risk levels:
- Stage 1 (Charles Street to Fell Street, including the Yilki Shops) is the highest-risk area experiencing severe erosion and frequent overtopping due to direct wave impact during large storm and swell events.
- Stage 2 (Fell Street to the Encounter Bay Boat Ramp, near The Bluff) is more sheltered from wave action, with a lower erosion risk. However, some low-lying areas have historically experienced overtopping during extreme conditions.
This staged approach prioritises critical protection measures yet allows for long-term adaptation along the coastline.
During the consultation and design process, the larger coastal stages were further divided into shorter segments of coast based on risk levels and the effectiveness of existing protection measures. This approach enabled a refined seawall design, with site-specific adjustments to elements such as crest height and toe depth, ensuring the solution was tailored to local conditions.
Key factors that influenced the increased nearshore wave climate and shoreline erosion along the coast:
- There is a natural gap in the offshore reef system in front of the stage 1 ‘Yilki’ area. Unlike other sections of the coastline where the reef provides a natural buffer against wave energy, this gap allows waves to reach the shore with higher energy, exacerbating erosion and overtopping issues. The increased wave energy in this region accelerates the loss of beach material, leading to a lower beach profile and further compromising the effectiveness of existing defences.
- Offshore islands significantly influence incident waves, affecting their propagation and behaviour as they approach the shore. In the study area, wave diffraction and refraction caused by Wright Island led to wave interactions that intensify and merge on the landward side, potentially increasing erosion in the study area. This effect is evident in satellite imagery (see Figure 5).

Figure 5a: Refraction of waves around Wright Island.
- © Google EarthEncounter Bay Fig 5a

Figure 5a: Refraction of waves around Wright Island.
© Google Earth

Figure 5b: Diffraction of waves around Wright Island.
- © Magryn & Associates Pty LtdEncounter bay fig 5b
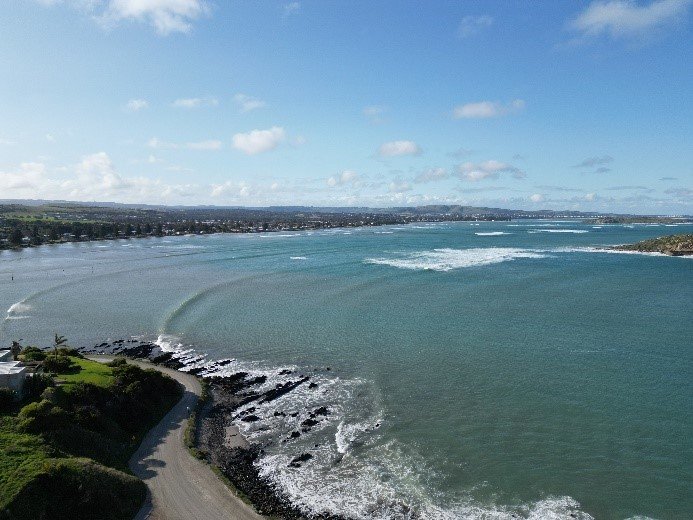
Figure 5b: Diffraction of waves around Wright Island.
© Magryn & Associates Pty Ltd
To address these risks, the Coastal Adaptation Strategy integrates erosion/flood protection with planned upgrades to the Encounter Bikeway. The strategy envisions the Bikeway as the “spine” of the defence system, with protection works abutting it.
Currently, the Bikeway in this section experiences frequent overtopping due to coastal erosion and the seaward extension of the road, which has pushed the shoreline further out. This configuration results in wave action directly interacting with the defences instead of dissipating its energy across a natural beach. To address this, the detailed design retains the hard edge of the Bikeway at its existing alignment, necessitating a higher coastal defence structure.
The overall proposed works includes:
- raising and widening the Encounter Bikeway to enhance flood protection
- construction of a rock seawall to provide erosion protection: in some sections of the coast there is an existing rock seawall, but the crest is not high enough and the wall is overtopped
- installation of a wave overtopping barrier at high-risk locations
- redesign of stormwater outfalls to mitigate blockages and seawater backflow
- Improved beach access to maintain public connectivity to the shoreline
By integrating these measures, the project aims to provide immediate and long-term protection to community facilities, including the Encounter Bikeway, road infrastructure, and buildings. The proposed upgrades aim to enhance the existing coastal protection infrastructure, improving coastal resilience and mitigating disaster risk due to storm surges and climate change-driven sea level rise.
Historical erosion analysis and adaptation needs
A historical erosion analysis helped to further understand and predict future trends.
Long-term beach surveys by Department for Environment and Water (DEW, surveyed since 1977) indicate ongoing erosion cycles, with accelerated recession since 2018. Nearshore beach levels near Tabernacle Road have dropped by 800mm from 2021 to 2022 and 1500mm since 2018, reaching their lowest recorded level in 2023 (as clearly seen in the satellite images below). Digital Earth Australia (by Geosciences Australia) shoreline mapping also clearly depict this recession trend.
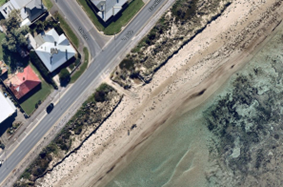
Figure 6a: Erosion in 2020 (compare with Figure 6b).
- © NearmapEncounter Bay Fig 6a

Figure 6a: Erosion in 2020 (compare with Figure 6b).
© Nearmap
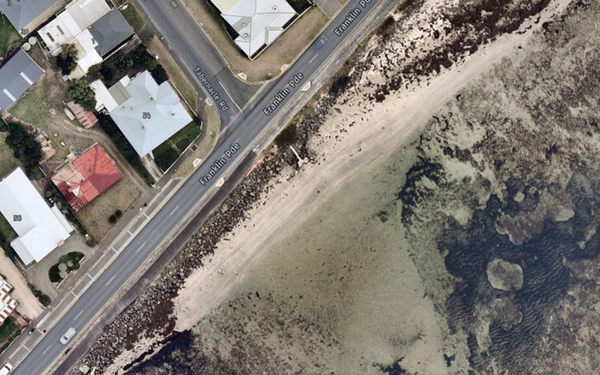
Figure 6b: Erosion in 2023
- © NearmapEncounter Bay Fig 6b
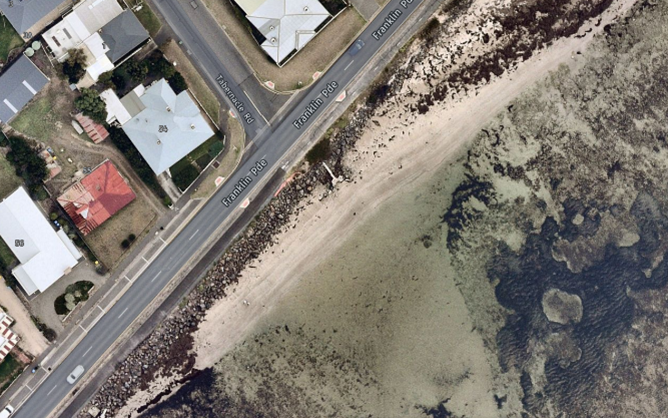
Figure 6b: Erosion in 2023
© Nearmap

Figure 7: Digital Earth Australia (by Geosciences Australia)
- © Geosciences AustraliaEncounter bay Fig 7
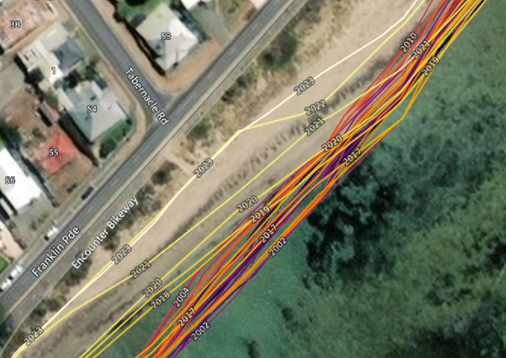
Figure 7: Digital Earth Australia (by Geosciences Australia)
© Geosciences Australia

Figure 8: DEA maps, with the highlest levels of retreat shown in dark red.
- © Geosciences AustraliaEncounter Bay Fig 8
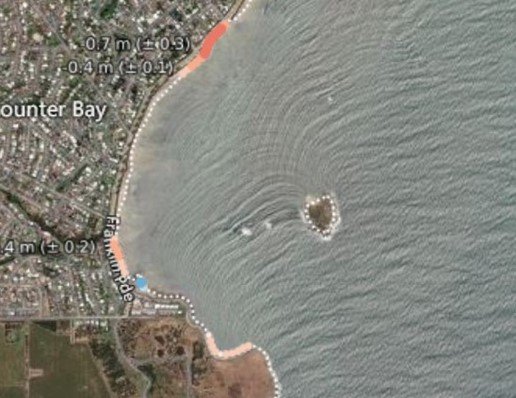
Figure 8: DEA maps, with the highlest levels of retreat shown in dark red.
© Geosciences Australia
Adaptation options
Due to the limited space between permanent infrastructure (roads and buildings) and the beach, the available long adaptation options were limited. In this case, a "hold the line" strategy using a hard seawall structure was the only viable approach to provide long term resilience. However, a staged construction approach was adopted based on a coastal hazard risk framework (as discussed above).
Short term and supplementary strategies recommended included routine coastal monitoring (particularly after storm events), beach nourishment and landscaping of the foredune.
Wave overtopping sensitivity analysis
A sensitivity analysis was carried out at conceptual design stage, to identify the optimal seawall crest level that minimises the risk of wave overtopping/ flooding while considering varying beach levels, water levels, and wave periods.
Different crest heights were tested using numerical wave model results as inputs to empirical overtopping equations to assess the probability and rate/volume of overtopping under different storm conditions. Wave overtopping analysis was conducted using Eurotop (Manual on wave overtopping of sea defences and related structures, 2018). This analysis determines the overtopping discharge rate and overtopping volume. The discharge rate is primarily a function of the freeboard (difference between still water level and crest level) and wave height. The overtopping volume is additionally a function of the storm duration.
The calculated overtopping is compared to a tolerable overtopping rate and volume from Eurotop. The tolerable rate depends on the purpose of the wall but for the protection of pedestrians an overtopping rate of 20 L/s/m and overtopping volume of 600 L/m is recommended which was adopted. Based on this a crest level of 3.4m AHD was chosen for the rock seawall. For areas that require additional protection a concrete wave overtopping barrier with a crest level of 3.6m AHD was adopted.
This analysis allowed for a balance between the structure footprint (crest height and width), cost, and effectiveness in mitigating wave impacts.

Figure 9: Overtopping definition sketch from Eurotop.
- © EurotopEncounter Bay Fig 9
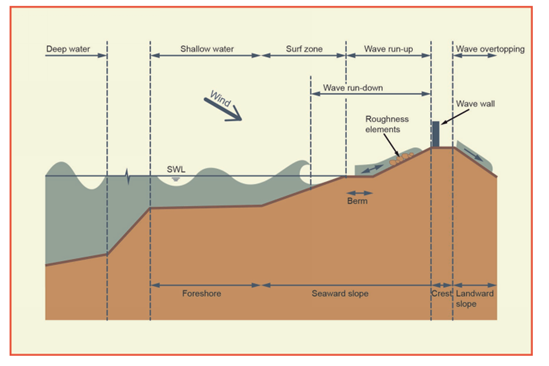
Figure 9: Overtopping definition sketch from Eurotop.
© Eurotop
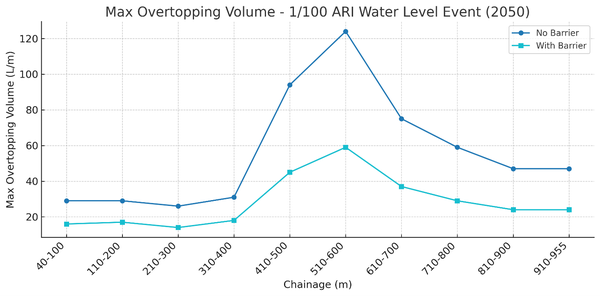
Figure 10: Overtopping results for Encounter Bay Stage 2.
- © Magryn & Associates Pty LtdEncounter Bay Fig 10
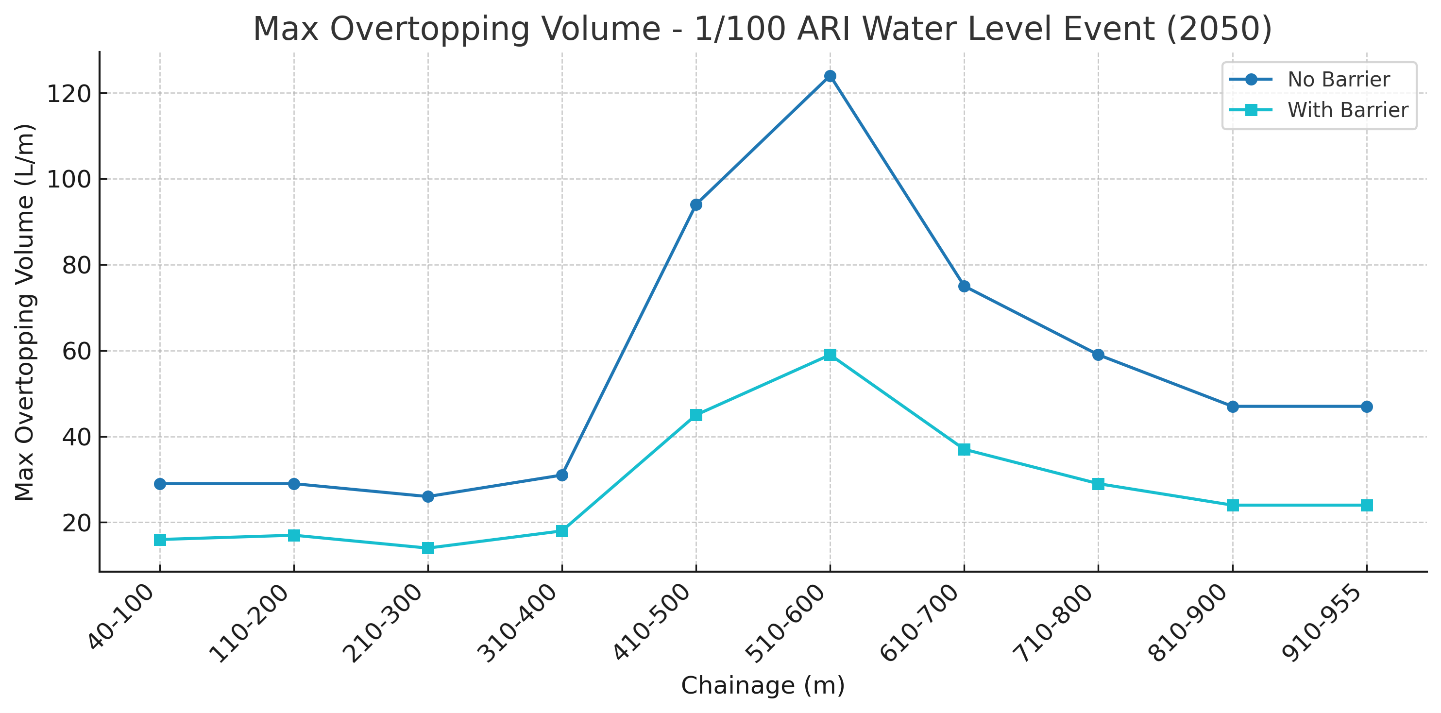
Figure 10: Overtopping results for Encounter Bay Stage 2.
© Magryn & Associates Pty Ltd
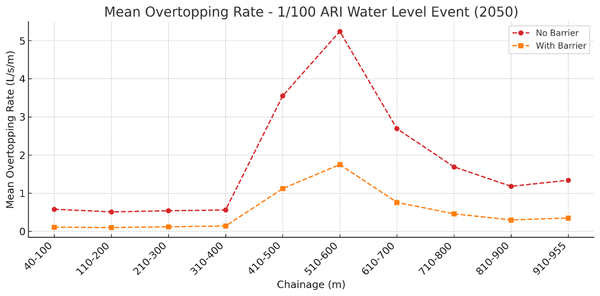
Figure 11: Overtopping results for Encounter Bay Stage 2.
- © Magryn & Associates Pty LtdEncounter Bay Fig 11
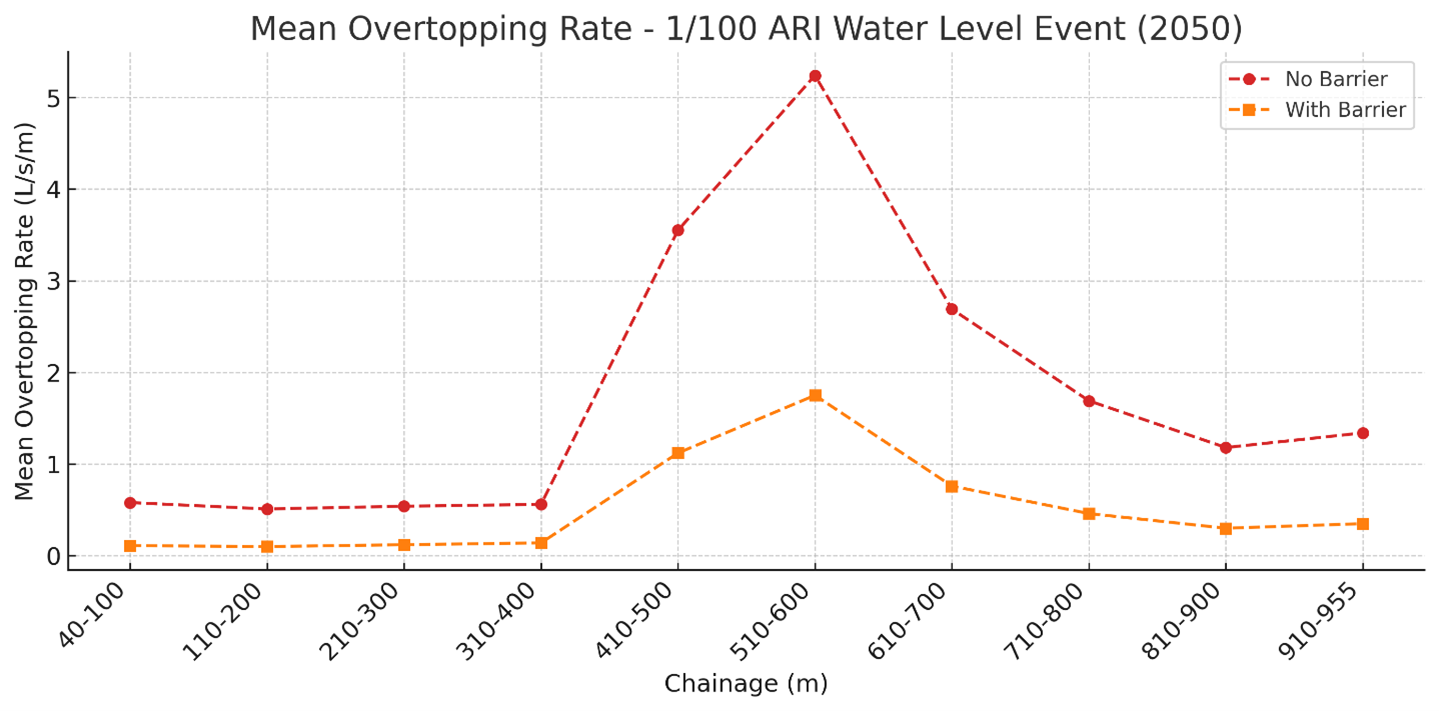
Figure 11: Overtopping results for Encounter Bay Stage 2.
© Magryn & Associates Pty Ltd
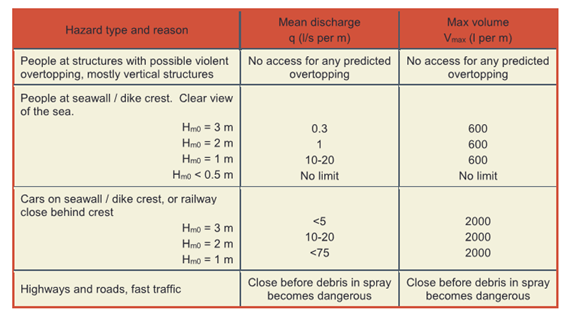
Figure 12: Tolerable overtopping limits.
- © EurotopEncounter Bay Figure 12

Figure 12: Tolerable overtopping limits.
© Eurotop
Wave modelling
To quantify and predict the nearshore wave climate resulting from complex coastal processes, Port and Coastal Solutions were engaged to simulate a spectral wave (SW) model for the site. The MIKE SW model was configured to simulate wave conditions over a 10-year period, providing hourly results.
The MIKE SW model is a powerful tool for analysing wave climates in offshore and coastal environments, capturing nonlinear wave-wave interactions, wave breaking due to depth limitation, bottom friction and wave dissipation over varying seabed conditions, diffraction and refraction around coastal structures and islands.
This detailed analysis ensures the predicted wave climate is representative of real-world conditions, improving the reliability of coastal engineering designs.
Results from the SW model were extracted at representative nearshore locations along the seawall alignment. Spatial maps of wave heights and directions were generated for different storm events, illustrating the effects of offshore wave conditions and storm surges.
Two key scenarios were examined:
- A wave event that coincided with a major storm surge, resulting in large nearshore waves.
- A large offshore wave event without a storm surge, leading to reduced nearshore wave energy.
The design wave heights and periods obtained from the model provided critical input parameters for seawall design and overtopping assessments.

Figure 13: Wave climate for Encounter Bay (Charles St to Fell St).
- © Port and Coastal SolutionsEncounter Bay Fig 13
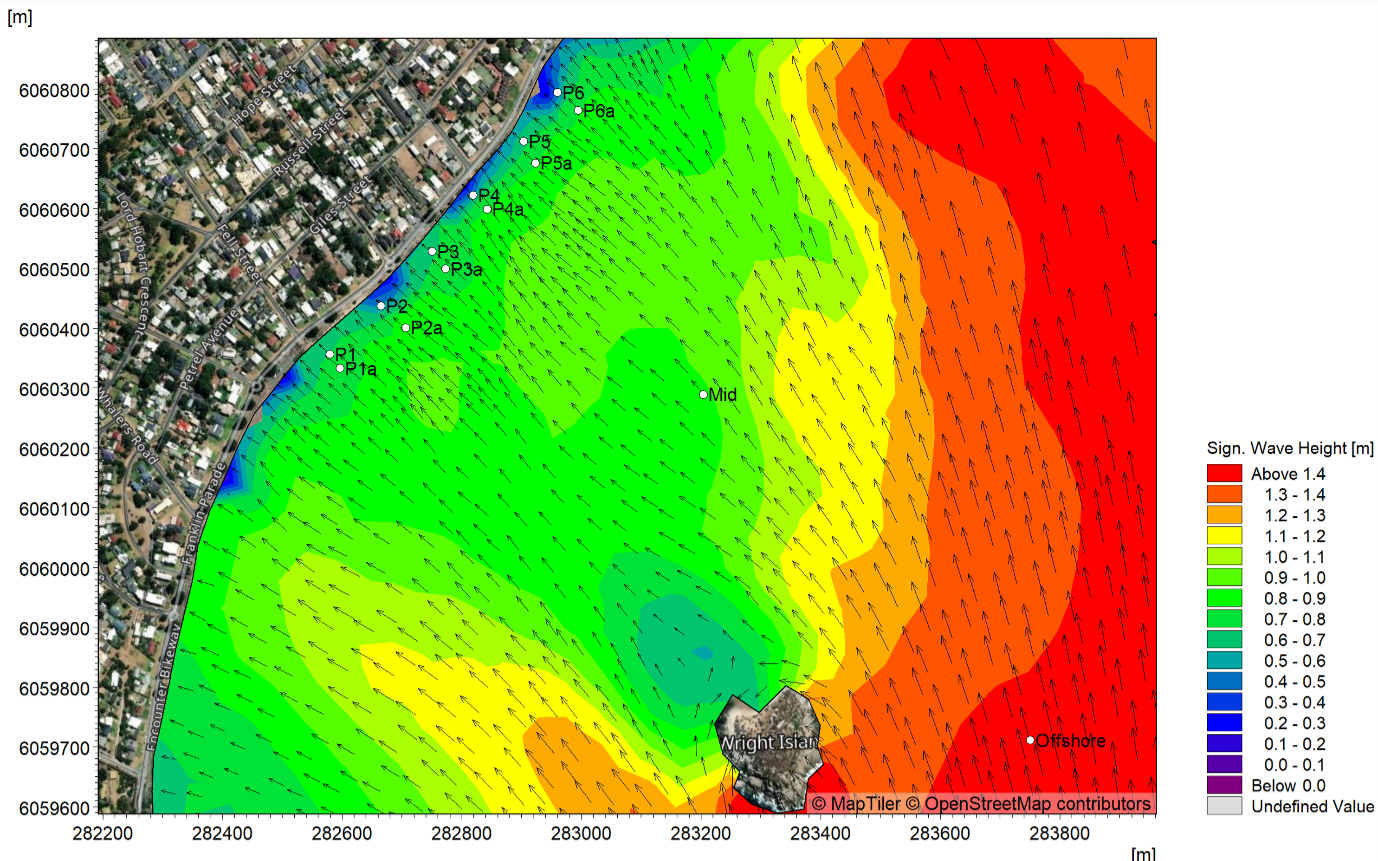
Figure 13: Wave climate for Encounter Bay (Charles St to Fell St).
© Port and Coastal Solutions

Figure 14: Wave climate for Encounter Bay (Fell St to Boat Ramp).
- © Port and Coastal SolutionsEncounter Bay Fig 14
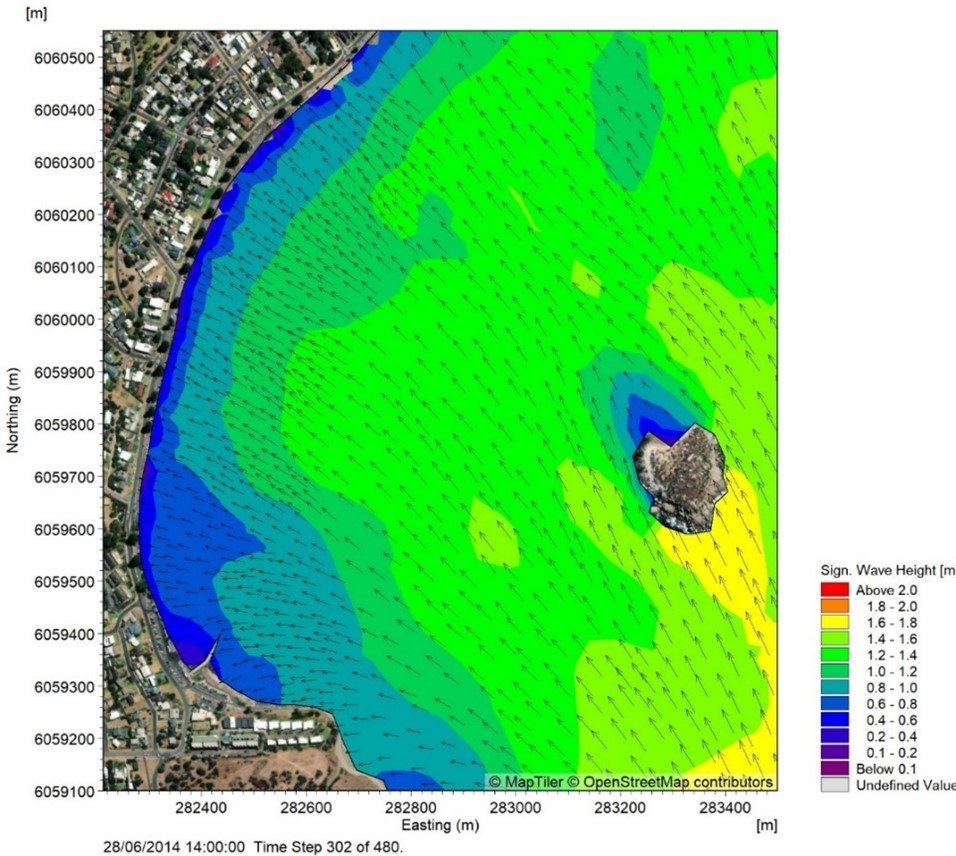
Figure 14: Wave climate for Encounter Bay (Fell St to Boat Ramp).
© Port and Coastal Solutions
Engineering design
The structure was designed for a 50-year design life as well as to accommodate a 100-year ARI storm event which corresponds to a 1% annual exceedance probability. The structure was designed for 0.3m of sea level (projected for 2050) with the ability to be upgraded for an additional 0.7m of sea level rise (projected for 2100). These sea level rise projections align with advice from Department for Environment and Water.
Additional considerations include minimising the footprint of the structure as well as avoiding the obstruction of coastal views were possible. Maintaining access to the beach was an important consideration.
The first step in the design process was to conduct a geotechnical investigation with boreholes and dynamic cone penetrometer tests. This is critical in identifying a non-erodable layer to provide a foundation for the toe rock of the seawall and prevent failure of the seawall due to undermining in the event of erosion of the beach.
Assessing the wave climate and water levels was another critical step. The design still water level was determined as the predicted storm surge corresponding to a 100year ARI storm event in 2050. This was determined as 2.05-m AHD, a level that was validated by CSIRO and Department for Environment and Water (DEW).
The rock sizes for the seawall were determined using the CIRIA Rock Manual based on the stability under wave action. The primary armour comprises rocks with a mean size of 900-1000 mm and a mean mass of 1.7-2.5 tonnes. The secondary filter armour layer comprised rocks between 400 and 500 mm in size and 0.17 to 0.25 tonnes in weight. A geotextile filter layer was incorporated below the secondary armour, to prevent washout of fines through the seawall.
The force on the wave overtopping barrier was also determined based on the CIRIA Rock Manual. This was then designed as a concrete wall with a toe and shear key to prevent sliding and overturning under wave loads. The wall was reinforced with glass fibre reinforced polymer (GFRP) reinforcement to remove the risk of corrosion in the marine environment. A typical section of seawall is shown in Figure 15.
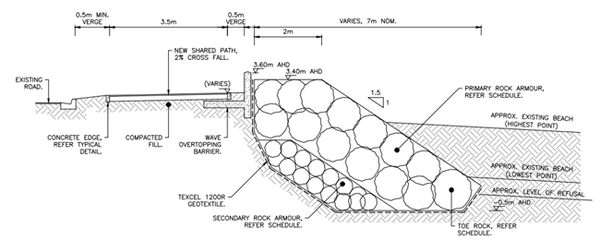
Figure 15: Typical seawall section.
- © Magryn & Associates Pty LtdEncounter Bay Fig 15

Figure 15: Typical seawall section.
© Magryn & Associates Pty Ltd
Other aspects of the project which integrated with the seawall design were:
- Shared path/Bikeway upgrade: Designed to meet Austroads Guide to Road Design - Part 6A requirements.
- Beach access stairs and ramps: Stairs over the seawall were designed using fibre-reinforced polymer (FRP) to enhance durability in the marine environment. Fibre reinforced concrete access ramps were also provided for maintenance vehicle and improved access to the beach.
- Stormwater Outfalls: Extended through the seawall with added scour protection to prevent beach erosion, and a tidal flap to prevent seawater backflow.
Consultation and partnerships
Consultation and collaboration were undertaken throughout the design process with key stakeholders including local (Council) and State Government (Coastal Protection Board, of the Department for Environment and Water), and external specialist coastal scientists/modelers.
Community engagement was previously undertaken as part of the coastal adaptation study, and the results of this helped to inform the protection strategy adopted.
These partnerships were crucial in ensuring the project aligned with local priorities, community expectations and regulatory requirements. The collaborations also ensured that the selected adaptation actions were practical, feasible, and based on rigorous scientific data.
Maintaining strong partnerships and open communication with stakeholders was critical through the coastal study and design process, to ensure the strategies developed aligned with community expectations and was endorsed at local and state government levels.
Planning and funding
The adaptation actions were planned based on detailed risk assessments and modeling of coastal hazard scenarios as discussed in this case study. The funding for the project was secured by City of Victor Harbor, through the Disaster Ready Fund, administered by the South Australian Fire and Emergency Services Commission.
The construction is expected to be completed in stages, with stage 1 being the first to be implemented.
Outcomes and next steps
The project has successfully defined a clear roadmap for the staged construction of coastal protection measures. Immediate actions include monitoring the existing infrastructure and preparing for the construction of new protective works in the near future as erosion risks increase.
Specific next steps involve:
- tendering for construction of the protection works, which is underway in 2025
- implementation of stage 1, the segment of coast between Fell street and Charles St (the segment deemed highest priority in the Coastal Adaptation Study)
- monitoring of the coast between Fell Street and the Boat Ramp, in particular after severe storm events
- as the risks increase and funding becomes available, stage 2 will be implemented through the construction of new protective works, including rock seawalls and elevated paths.
Conclusions and lessons learned
The final seawall design successfully mitigates wave overtopping and erosion, ensuring long-term protection for the bikeway, road, and adjacent properties. The design minimises the structure’s footprint while preserving beach access and coastal views, as well as being adaptable for future sea level rise. The bikeway enhancements further improve recreational and commuting experiences along the scenic coastline.
The vertical concrete wave overtopping barrier proved to be an effective measure in limiting overtopping hazards to an acceptable level. Future projects should carefully assess wave overtopping rates and volumes, especially in high-energy environments, to ensure pedestrian and infrastructure safety.
An important validation step involved analysing the 2024 storm event, which provided real-world data to refine wave overtopping predictions. Post storm tide and wave data was analysed, and the erosion and wave overtopping impacts were inspected, to gain a clearer understanding of the real-world implications of the calculated wave conditions.
Quantity surveying and cost estimation were integrated throughout the design process to assess cost-saving opportunities and ensure financial feasibility. This approach allowed for informed decision-making on material selection, construction methods, and design refinements. Future projects should adopt a similar iterative cost analysis to optimize budget efficiency while maintaining design integrity.
Having a clear understanding of regulatory approval and construction considerations is important for coastal projects, considering factors such as:
- Are any specific environmental or ecological approvals or assessments required?
- Where would material be sourced from and stockpiled during construction?
- If excavation is required for founding of the toe of the seawall, and does the excavated material need to be disposed of of-site? In the case of the Encounter Bay project, there was an opportunity to utilize a portion of the excavated material elsewhere on site, such as to nourish the beach/foredune, providing additional erosion protection and an erosion buffer zone.
A key lesson learned from this project is the importance of taking a staged approach to coastal protection, particularly in areas with limited space for intervention. By dividing the coastline into segments and responding to the risks in a phased manner, the project can adapt to changing conditions over time.
Continued monitoring and adaptive management will be essential as the project progresses. If replicated, other areas should consider the unique local conditions, including available space, infrastructure, and environmental features, when developing their own adaptation strategies.
While a hold-the-line approach was necessary for Encounter Bay due to infrastructure constraints, other sites should consider alternative adaptation approaches where possible. A re-alignment of the foreshore, or managed retreat can have many benefits, such as allowing recovery of the beach, enhance long-term resilience and support natural coastal processes.
This project demonstrates a pragmatic coastal protection approach, balancing engineered hard structures with staged implementation based on risk assessment. By adopting a long-term vision with adaptability to future sea level rise, the City of Victor Harbor has taken a proactive stance in safeguarding this valuable coastal asset.
To cite:
This case study was prepared by Will Souter and Alex Sturm, Magryn & Associates Pty Ltd. Please cite as: Souter, W and A. Sturm. 2025: Coastal adaptation in Encounter Bay: Managing wave overtopping and future risks. Case study for CoastAdapt, National Climate Change Adaptation Research Facility, Griffith University, Gold Coast.
Further information
See the main project website for more information: https://www.victor.sa.gov.au/notice-board/projects/completed-projects/coastal-adaptation-study-review
For more details on wave overtopping analysis: Eurotop Overtopping Manual, a manual based on European research but useful globably.
For Digital Earth Australia (Geociences Australia Maps): https://maps.dea.ga.gov.au/