


Using the tool to explore sea-level rise for your area: are you a Wader or Diver?

Dive straight in to the tool - click here Sea-Level Rise and You

We suggest you read the general descriptions and guidance below.
At a glance
- CoastAdapt's tool, Sea-Level Rise and You, provides three sets of information for each coastal council in Australia:
- Section 1: sea-level rise scenarios, graphs, and data tables
- Section 2: inundation maps
- Section 3: extremes temperature and rainfall.
- How you access it depends on your level of experience:
- Have you previously used Sea-Level Rise and You? Then you are a Diver - dive straight into using it
- If you haven't used the tool before, then you are a Wader and we recommend you read the background to the datasets and their use.
CoastAdapt's tool to explore sea-level rise in a local government area
CoastAdapt’s Sea-Level Rise and You, is a tool that enables users to investigate future coastal risks at the scale of an Australian local government area. For each council area, the tool provides sea-level rise scenarios, graphs, and data tables; inundation maps; and climate information on temperature and rainfall.
How you access it depends on your level of experience: if you have some understanding of sea-level rise planning you are a wader or diver and if you are a complete beginner then you are a skimmer.
Sea-Level Rise and You is (sometimes referred to as SLR and You for brevity) useful for first and some second pass assessments: more complex or long lived assets will require more detailed and complex decision making.
Section 1. 'Sea-Level Rise and You' datasets: explore future risks using SLR graphs and tables
The datasets in Sea-Level Rise and You are for:
- every coastal local council in Australia
- the present-day at decadal intervals through to 2150
- up to five scenarios, now using Shared Socioeconomic Pathway (SSP) emission scenarios.
- more about climate scenarios
- how the new Shared Socioeconomic Pathways (SSPs) differ from the earlier Representative Concentration Pathways (RCPs) in the Explainer: SSPs and RCPs
- how to use scenarios and communicate scenarios.
In Sea-level Rise and You, we use the SSPs from AR6.
We label the SSPs or climate scenarios as:
- Low or 'Sustainability': SSP1-1.9
- Low-medium or 'Sustainability': SSP1-2.6
- Medium or 'Middle of the road': SSP2-4.5
- High or 'Regional rivalry': SSP3-7.0
- Very high or 'Fossil-fuelled development': SSP5-8.5
The terms (from low to high) refers to the change in greenhouse gas concentration in the atmosphere, not the absolute amount of how much greenhouse gas in the in atmosphere at any one time.
Note: all of the SSPs indicate an increase in atmospheric concentrations from the present day up to 2100.
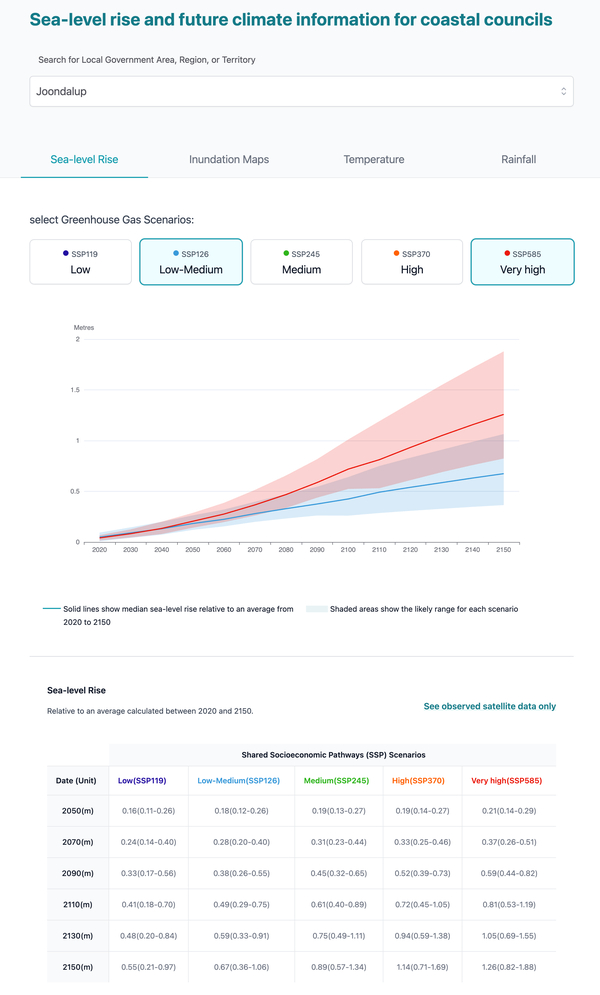
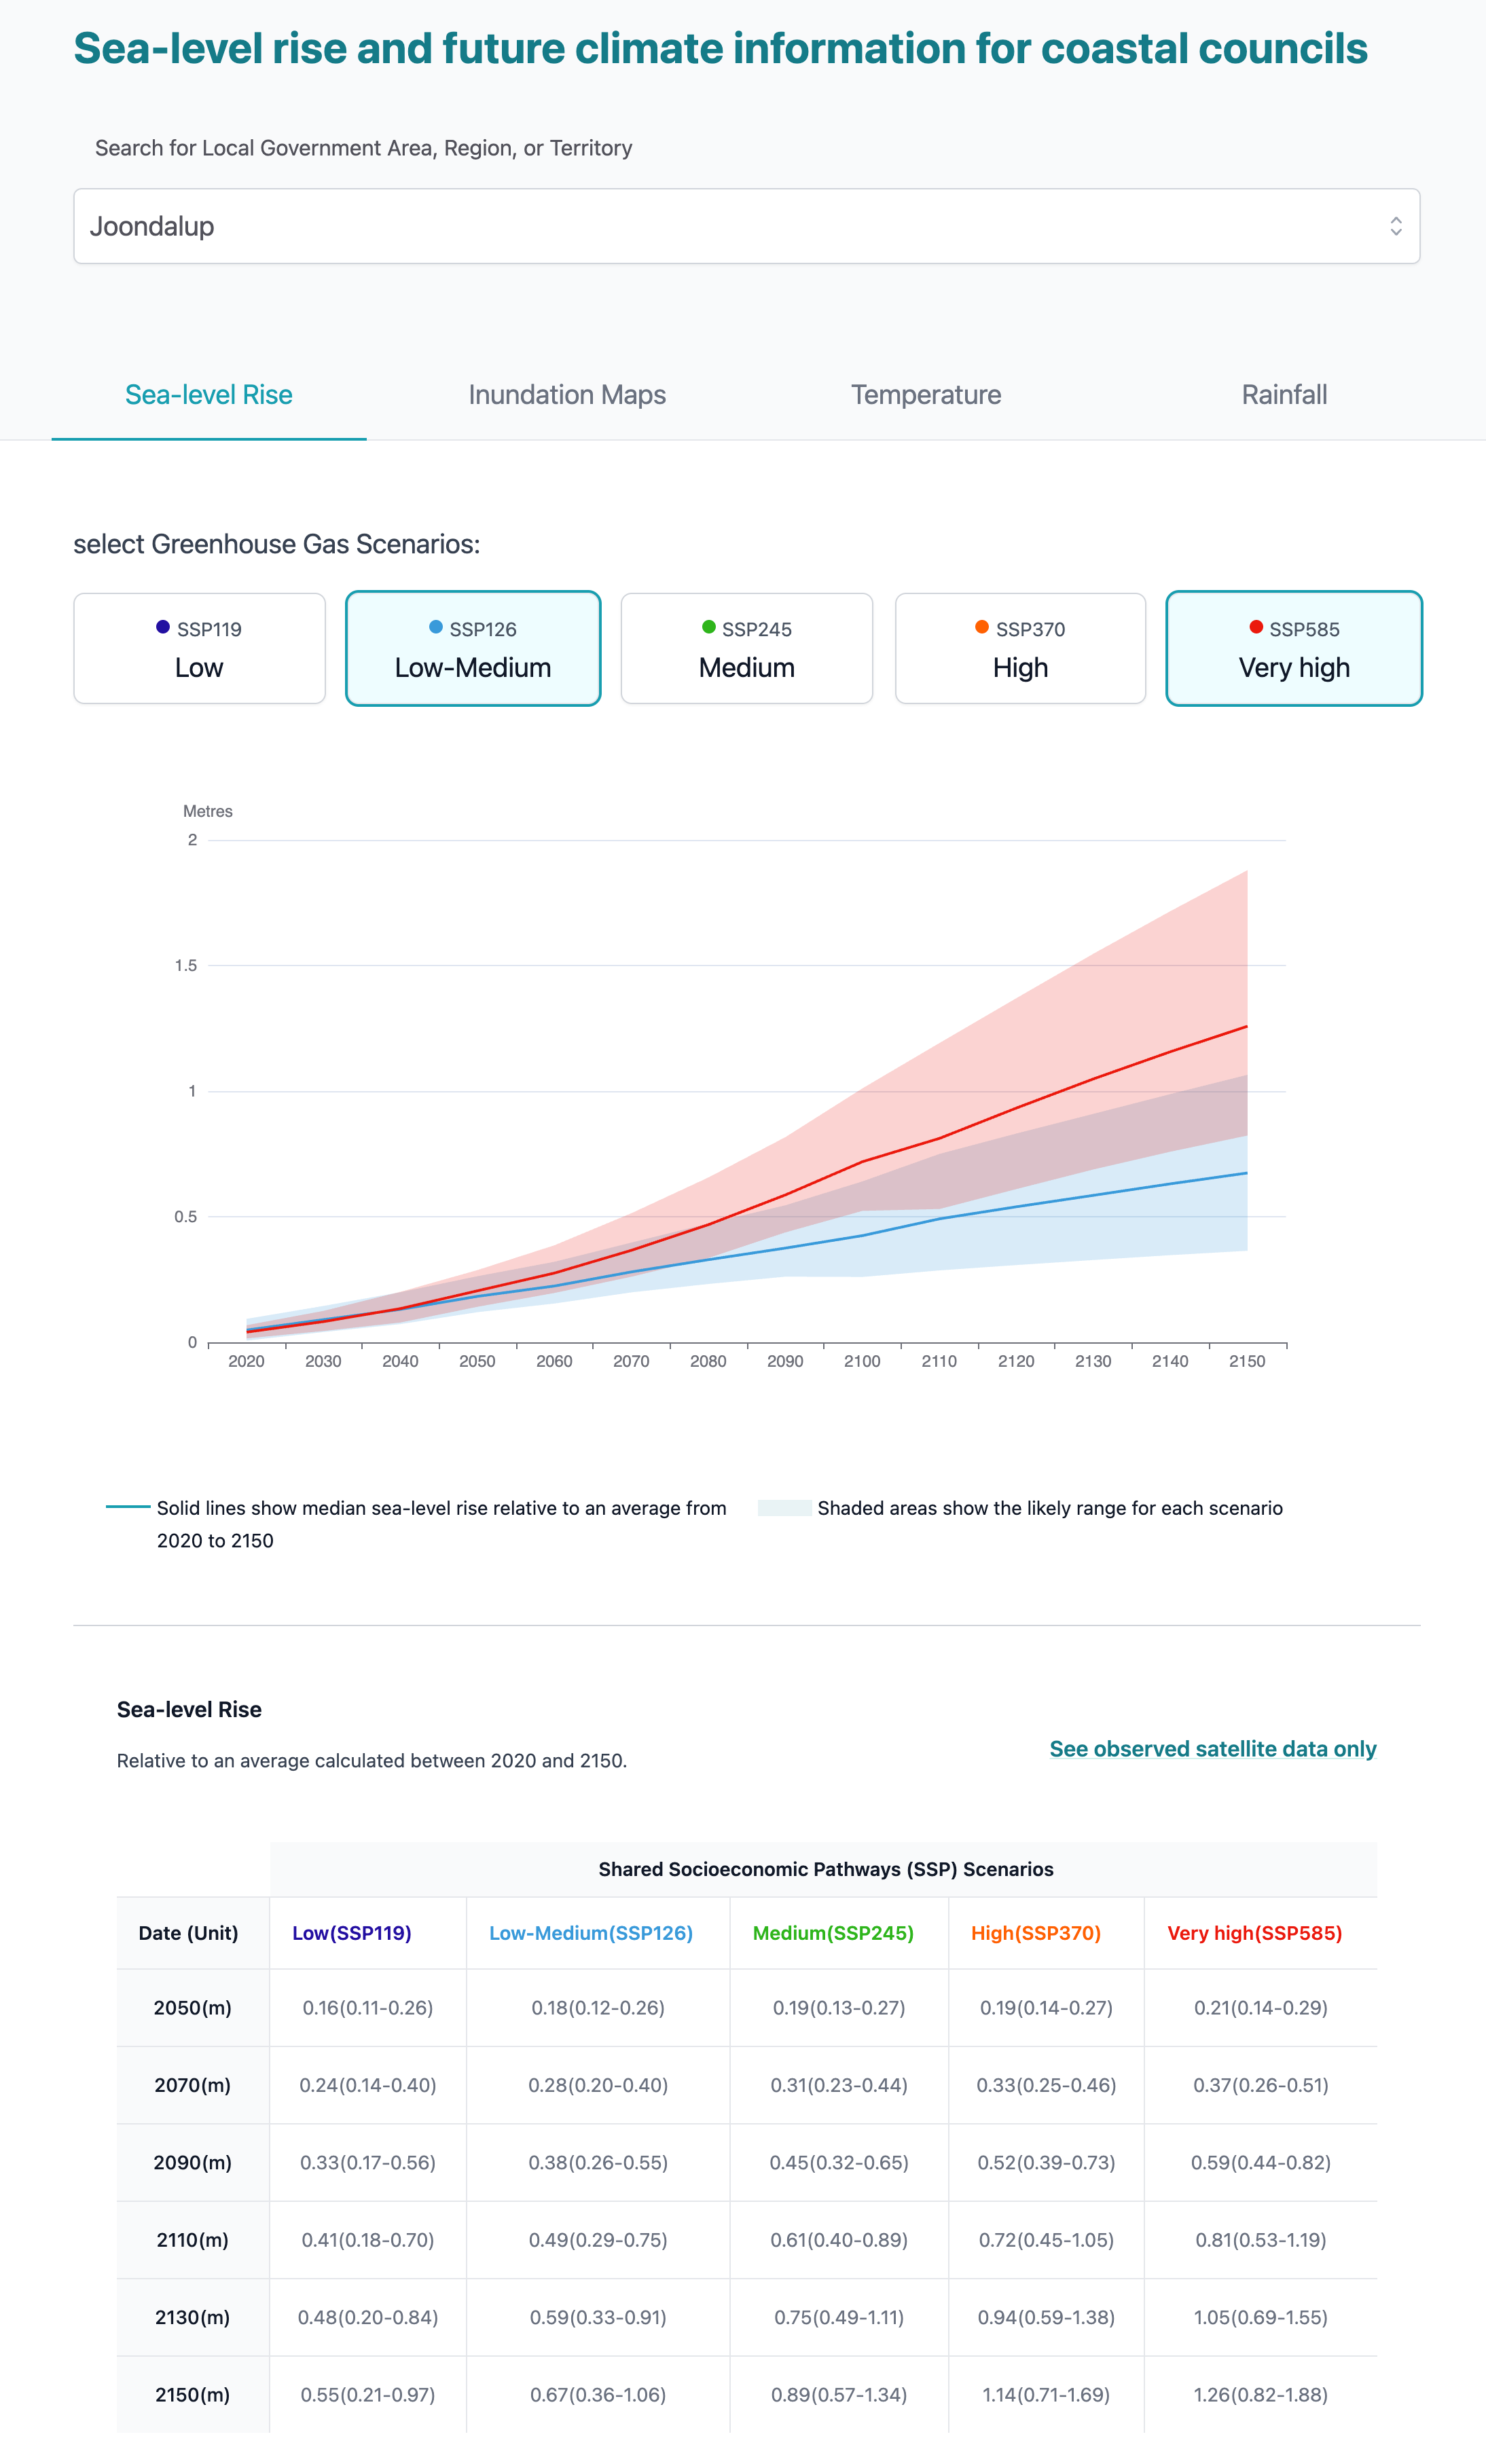
For every coastal council in Australia, Sea-Level Rise and You provides graphs and tables on:
- mean sea-level rise with a confidence interval
- the allowance, or the height that coastal defences would need to be raised in order to provide the same level of protection as they do today.
Information is provided for five SSPs, and from now to 2150.
- It takes account of both thermal and dynamic influences on sea level, including changes in ocean currents.
- It does not take account of changes in wave height or local land movements such as subsidence.
- The information is for the open coast: note that there may be additional change in closed bays or estuaries.
_______________________________________________________________________________________
SLR_overview
- Explainer: What are allowances?
- Explainer: What is bathtub modelling?
while Sea-Level Rise and You is designed to be highly intuitive, however, we strongly advise you to read the background about how the use and what to be aware of when using this tool:
- Guidance on how to use the tool is available in 'How to' use and present information from Sea-Level Rise and You
- CSIRO Guidance material describes the data, process and assumptions that underpin this data (CSIRO 2024). This is authored by the CSIRO scientists who developed the datasets that underpin the tool.
2. 'Sea-Level Rise and You': explore future risks using inundation maps
CoastAdapt provides maps of the extent of inundation. Inundation is defined here as the temporary flooding of a portion of land within the coastal zone.
- The maps are for five SSPs.
- Inundation is modelled using high-resolution digital elevation data and a simple 'bucket fill' or bathtub approach.
- Initiating sea-level rise information is taken from Sea-level Rise and You tables and graphs.
- The result is approximate only: the model does not take account of existing sea walls, storm surge, erosion etc.
- more extreme sea-level rise projections (including tides, storm surges and wave set-up) are available from CSIRO's Canute, designed for more advanced users
- additional inundation scenarios (different time periods, sea-level rise scenarios etc.) using the visualisation tool Coastal Risk Australia.
3. 'Sea-Level Rise and You': explore future risks using extremes of temperature and rainfall
For every coastal council in Australia, CoastAdapt provides graphs of future trends in:
- Hot days: Average annual number of days with maximum temperature greater than 30 °C
- Hot nights: Average annual number of days per calendar year with minimum temperature greater than 25 °C
- Heatwaves: Average duration of the longest run of consecutive days in each year with daily maximum temperature greater than 30 °C
- Very wet days: Average number of days per calendar year with daily rainfall greater than historic 99.9th percentile (reference period 1979 - 2024).
- Dry months: Average number of months in a 12-month period (May to April) where the monthly total rainfall is within the historic 10th percentile (reference period 1979 - 2024).
more about this data set in Sea-Level Rise and You: 'How to' use temperature and rainfall data.

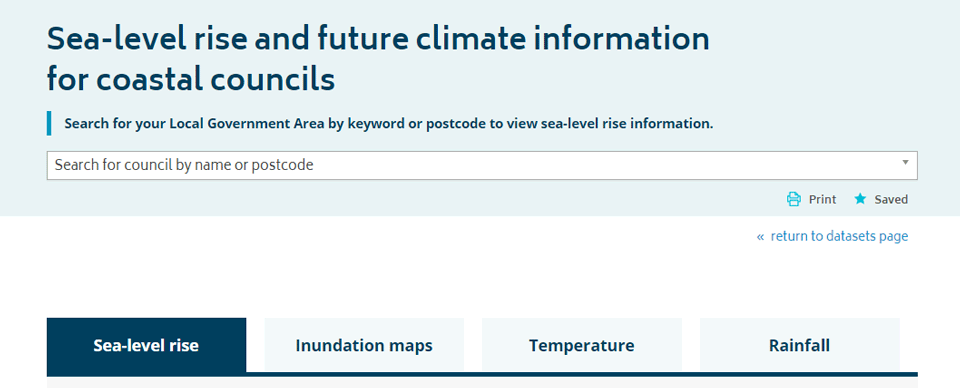
Click on the link to go to the Sea-Level Rise and You tool page.
In the search box, enter a council name or postcode and select one of the tabs to see information for the chosen council.
SLR-and-you-header
SLR-and-you-header
Acknowledgements
- Sea-level rise and allowances data was provided by CSIRO in a project led by Xuebin Zhang and Kathy McInnes. A detailed technical report (CSIRO 2024) describes the data, process and assumptions that underpin this data.
- Inundation mapping was provided by Dr Tek Raj Bhatt and Dr Patrick Norman from Griffith University's Climate Action Beacon and is described in this GU Technical Note.
- Temperature and rainfall extremes data were provided by CSIRO in a project led by John Clarke and Dr Malcolm King from CSIRO and NESP Climate Services. Information on the derivation of these datasets is available in this Technical Note from CSIRO.