


At a glance
- Australia's most damaging windstorms are tropical cyclones and East Coast Lows (ECLs).
- Tropical cyclones form mainly north of Exmouth in the west and Rockhampton in the east during the November–April season. Australia averages 11 cyclones annually, with four making landfall and about half becoming severe.
- Fewer cyclones are projected in the future, they are expected to be more intense and may shift further south.
- ECLs affect southern Queensland, New South Wales, and eastern Victoria, occurring year-round but peaking in autumn and winter. Around 10 form each year, with one typically causing major damage. Climate change is expected to reduce their frequency.
- Both storm types can produce destructive winds, heavy rain, and storm surges, threatening lives, property, and ecosystems, especially in low-lying coastal areas. Increasing storm intensity will heighten these risks.
Australia's damaging windstorms
Australia’s most destructive windstorms come in two main forms: tropical cyclones and East Coast Lows (ECLs).
They are both powerful weather systems that bring heavy rain, strong winds, and often result in storm surge and coastal erosion. Each of these has its own character, season, and region of impact. Both pose serious threats to communities, infrastructure, and natural systems, especially in coastal areas.
As the climate changes, and these storms grow more intense, the risks will only increase, especially for those living in vulnerable, low-lying coastal areas.
Tropical cyclones
detailed information about cyclones - past and future - through the Tropical Cyclone Knowledge Centre, Bureau of Meteorology.
Bom cyclone data portal

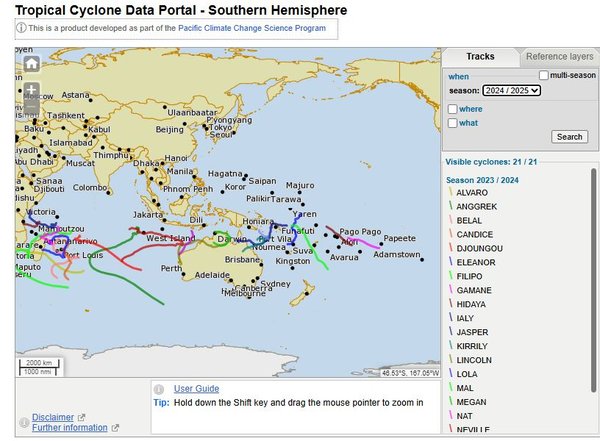
Bom cyclone data portal
Tropical cyclones are spiraling storms of destructive wind and rain that occur across northern Australia. They are defined as intense low-pressure storms that develop over warm ocean waters (temperatures greater than 26.5°C) with sustained gale force winds of at least 63 km/h.
Cyclone intensity is described in categories ranging from 1 (weakest) to 5 (strongest), and this relates to the maximum mean wind speed, does not consider other hazard such as heavy rain (and flooding, storm surge or coastal erosion).
BoM's explanation of tropical cyclone categories
BoM's explanation of storm surge, which is often associated with extreme weather events such as cyclones.
the UK Met Office's explanation of storm surge internationally.
| Category of Tropical Cyclone | Sustained winds (km/h) | Strongest wind gust (km/h) | Typical impacts | Recent example |
|---|---|---|---|---|
| Category 1 Tropical Cyclone | 63 - 88 | Below 125 | Damaging winds. Negligible house damage. Damage to some crops, trees and caravans. Craft may drag moorings. | TC Alessia (2013) |
| Category 2 Tropical Cyclone | 89 - 117 | 125 - 164 | Destructive winds. Minor house damage. Significant damage to signs, trees and caravans. Heavy damage to some crops. Risk of power failure. Small craft may break moorings. | TC Dylan (2014) |
| Category 3 Severe Tropical Cyclone | 118 - 159 | 165 - 224 | Very destructive winds. Some roof and structural damage. Some caravans destroyed. Significant damage to crops and trees. Power failures likely. | Justin (1997) |
| Category 4 Severe Tropical Cyclone | 160 - 199 | 225 - 279 | Significant roofing loss and structural damage. Many caravans destroyed and blown away. Extensive damage to vegetation. Dangerous airborne debris. Widespread power failures. | Tracy (1974) Debbie (2017) |
| Category 5 Severe Tropical Cyclone | Over 200 | Over 280 | Extremely dangerous with widespread destruction of buildings and vegetation. | Yasi (2011) |
.
The pattern of cyclones - when and where they occur
Future projections indicate a decrease in the overall number of tropical cyclones, yet an expected increase in the proportion of severe cyclones.
IPCC Sixth Assessment Report (AR6)
Australia is one of the most cyclone-prone regions in the world, particularly along the northern coastal areas of Western Australia. Tropical cyclones primarily occur between November and April, affecting the northern half of the country – north of Exmouth in the west and north of Rockhampton in the east.
These systems typically last several days and follow a path with a general west-to-east component. Once a cyclone moves over land, it is cut off from its energy source (warm ocean water) and begins to weaken and dissipate.
Over the past two decades, Australia has experienced an average of 11 tropical cyclones per year, with about four making landfall annually. The total number of cyclones appears to have declined up until the mid-1980s and has since remained relatively stable.
There has been no observed long-term trend in the frequency of severe tropical cyclones – those with a minimum central pressure below 970 hPa.
The frequency and behavior of tropical cyclones are also influenced by climate patterns such as El Niño and La Niña, which affect wind patterns and sea surface temperatures. El Niño events, characterized by weaker east-west atmospheric circulation in the equatorial Pacific, tend to bring fewer cyclones. La Niña events, with stronger circulation, typically bring more cyclones.
Tropical cyclones in early 2025
East coast: Tropical Cyclone Alfred, March 2025
WATCH: ABC news: Queensland beaches badly affected by ex-Tropical Cyclone Alfred. Published 15 Mar 2025
Severe Tropical Cyclone Alfred formed northeast of Cooktown, Far North Queensland on 21 February 2025, intensifying into a Category 4 system by 27 February while remaining offshore.
After 'meandering' for several days, TC Alfred eventually made landfall on Moreton Island, just off Brisbane, on 7 March as a Category 1 cyclone: once it crossed land it weakened, but continued to drop significant amounts of rain across South East Queensland and northern New South Wales.
TC Alfred brought destructive winds, heavy rainfall, and large coastal swells, leading to widespread power outages, structural damage, flooding, and severe coastal erosion.
Notably, TC Alfred affected areas more southwards of the typical cyclone zone, highlighting the need to expand extreme event preparedness across southern regions.
The slow passage of Alfred southwards parallel to the Queensland coast produced large easterly swell that impacted the coastline of southeast Queensland and northeastern New South Wales causing significant coastal erosion. It is estimated that millions of cubic metres of sand were scoured from beaches leaving escarpments up to 6 metres high in some dunes during the prolonged event.
Bureau of Meterology 2025
West coast: Severe Tropical Cyclone Zelia, February 2025
ABC news: Tropical Cyclone Zelia impacts WA's Pilbara region. Published 14 February 2025.
Severe Tropical Cyclone Zelia was a small but intense system that rapidly intensified to Category 5 strength off the Pilbara coast of Western Australia in February 2025. Forming as a tropical low (18U) near the Kimberley coast on 8 February, it was named Zelia on 12 February when located about 280 km west of Broome.
A marine heatwave – with sea surface temperatures of 31-32°C – fueled Zelia, which reached Category 5 by midday on 13 February.
On 14 February at 12:30 pm AWST, Zelia made landfall on 14 February northeast of Port Hedland, as a high-end Category 4 cyclone.
Fortunately, the cyclone's destructive core did not directly impact major towns and there were no fatalities.
However, Port Hedland experienced damaging winds with gusts up to 120 km/h, and Marble Bar recorded gusts up to 109 km/h as the system moved inland. Zelia rapidly weakened after landfall, downgrading to a tropical low by 2 am WST on 15 February near Marble Bar.
The cyclone brought significant rainfall, with De Grey and Pardoo stations recording over 500 mm in three days, leading to record flooding on the De Grey River. Marble Bar experienced a river peak of 10.23 m, surpassing the previous record of 8.3 m from 1998.
Cyclone preparations included the closure of more than a dozen schools and establishment of evacuation centers, and suspension of operations at key ports: Port Hedland (three days), Cape Lambert and Dampier. There were significant economic costs to industry through port closures and disruptions to offshore oil and gas operations
East Coast Lows
No significant trend observed in the number of East Coast Lows.
IPCC Sixth Assessment Report (AR6).
Severe storms include East Coast Lows (ECLs) that affect the eastern coast of Australia (southern Queensland, New South Wales, eastern Victoria, occasionally eastern Tasmania).
These can occur any time of the year: they are most frequent in June. ECLs can develop and intensify rapidly overnight making them dangerous and very difficult to predict.
ECLs can develop from a range of weather conditions: from ex-cyclones in summer or in the wake of a cold front that is crossing from Victoria into the Tasman Sea.
ECLs can drop large amounts of rainfall and make an important contribution to a region’s water resources. Often they play a role in seasonal variability of rainfall east of the Great Dividing Range
a video about Climatedogs: Eastie is a frisky pup and often unpredictable!
ECLs can develop from a range of weather conditions: from ex-cyclones in summer or in the wake of a cold front that is crossing from Victoria into the Tasman Sea.
ECLs can drop large amounts of rainfall and make an important contribution to a region’s water resources. Often they play a role in seasonal variability of rainfall east of the Great Dividing Range

The Pasha Bulker storm, Newcastle 2007. A series of five ECLs impacted the coasts of Newcastle during June 2007 and resulted in wind damage and widespread flooding, coastal erosion. The first of these caused the grounding of the Pasha Bulker (a 40,000 T bulk carrier ship) on Nobbys Beach on 8 June, and the loss of nine lives.
- © PJRosenbergerFCCPJRosenbergerFCC
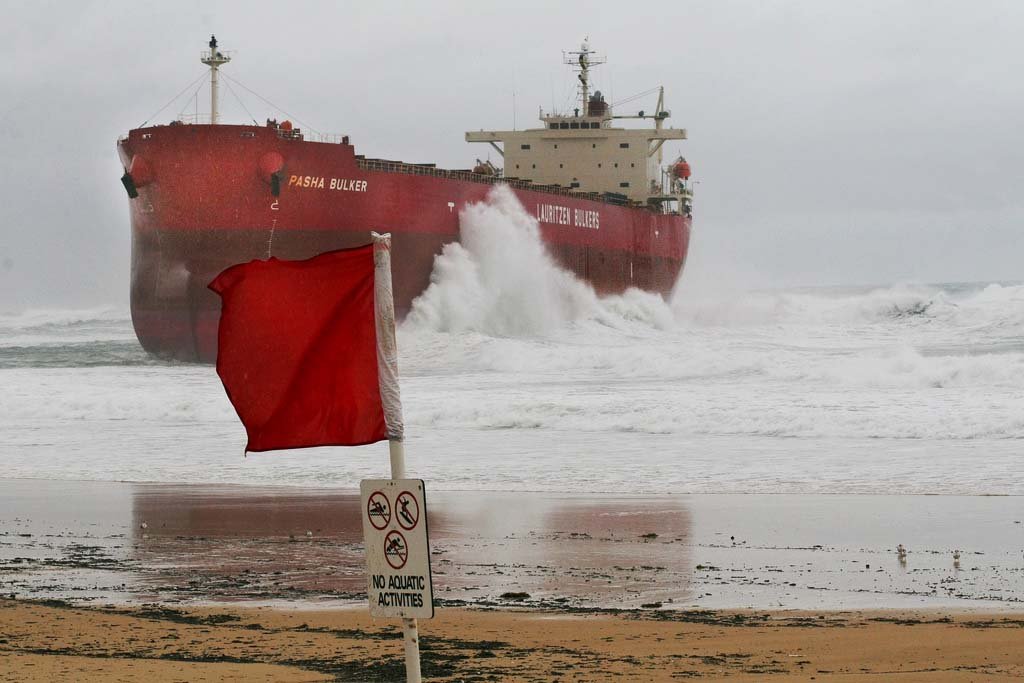
The Pasha Bulker storm, Newcastle 2007. A series of five ECLs impacted the coasts of Newcastle during June 2007 and resulted in wind damage and widespread flooding, coastal erosion. The first of these caused the grounding of the Pasha Bulker (a 40,000 T bulk carrier ship) on Nobbys Beach on 8 June, and the loss of nine lives.
© PJRosenbergerFCC
The differences between tropical cyclones and East Coast Lows
Tropical cyclones and East Coast Lows are both powerful and damaging weather systems however, they are different in several ways
| Attribute | Tropical Cyclones | East Coast Lows |
|---|---|---|
| Where they form | Form in tropical northern Australia, especially over warm ocean waters (typically with sea surface temperatures greater than 26°C), | Develop off the south-eastern coast, mainly NSW and southern QLD. |
| When they occur | Common in summer and early autumn (Nov–Apr) | Can occur any season but are more likely in late autumn to winter (May–Oct) and most frequent in June |
| How they form | Formed by barotropic processes (warm-core), powered by warm sea surface temperatures ≥26.5°C | Typically formed by baroclinic or hybrid mechanisms (cold or hybrid-core), influenced by troughs and upper-level systems |
| How long they last | Can persist for days to weeks before they cross the coast (and then are no longer a cyclone) | Often shorter-lived than cyclones, but have high-impact within 1–3 days |
| Movement | Often travel west or south-west, potentially crossing land | May stall near the coast or drift southwards, affecting local weather for days |
| Structure | Warm-core, with a circular eye and symmetrical structure | Cold-core or hybrid, usually asymmetrical, lacking a distinct eye |
| Wind speed | Can reach very high windspeeds (≥63 km/h to over 200 km/h) | Usually wind speeds are lower than cyclones, but strong ECLs have winds that can still cause significant damage |
| Rainfall | Intense, widespread rain, especially in the tropics | Cause 50% of days with widespread heavy rainfall (>100mm) in eastern Australia |
| Typical hazards | High winds, storm surges, floods, especially in northern Australia | Heavy coastal rain, flash floods, erosion, and dangerous seas. |
.
Risks associated with tropical cyclones and East Coast Lows
The main risks with tropical cyclones and ECLs are strong winds, heavy rainfall, rough seas and storm surge.
Severe winds
Wind gusts near the centre of tropical cyclones can exceed 180 km/h.
ECLs generally have lower wind speeds but a gust of 165 km/h was recorded at Newcastle in 1974 during a storm that sank the bulk carrier named Sygna. Such violent winds can cause extensive property damage and turn airborne debris into potentially lethal missiles.
Heavy rainfall
Some of Australia's heaviest rainfalls have occurred in association with tropical cyclones and East Coast Lows. The maximum rainfall recorded during a Western Australian cyclone was 927 mm in 36 hours at Whim Creek in 1898 (BoM 2016).
More recently, in the wake of ex-Tropical Cyclone Alfred, Brisbane experienced its wettest day in 50 years, with 275 mm recorded overnight to March 10. In January 2025, Karratha in Western Australia recorded 274.4 mm in 24 hours, exceeding its entire monthly January rainfall record in a single day.
Rain can lead to flooding and landslides. Events where wind damages the structure and allows rain to penetrate can result in severe property and contents damage to houses. Flooding can affect vast areas, inundating land, isolating communities and destroying infrastructure.
Storm surge + high tide
Storm surge is a sudden rise of water (about two to five metres higher than the normal tide level) caused by onshore winds and atmospheric pressure changes in the ocean’s surface. It can extend many tens of kilometres from the storm centre and has the potential to cause extensive coastal inundation, as well as damage to port structures and ships in harbour.
If the surge occurs at the same time as a high tide then the area inundated can be extensive, particularly along low-lying coastlines. High waves can also exacerbate flooding. These events are expected to become more damaging and extensive as sea levels rise

Cyclone storm surge is even more damaging if it coincides with a high tide.
- © Bureau of Meteorology.storm surge introbox_BoM
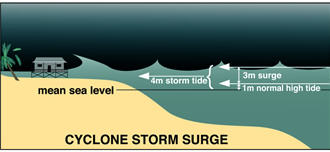
Cyclone storm surge is even more damaging if it coincides with a high tide.
© Bureau of Meteorology.
What are the impacts of severe storms
People and communities
Loss of life can occur during windstorms, especially tropical cyclones, and in the past these numbers have been very high (e.g. 300 people died in Bathurst Bay, Queensland during cyclone Mahina in 1899).
Cyclone-related flood events can cause death by drowning, while strong winds have the potential to kill and generate injuries due to falling masonry and flying debris.
However, deaths associated with tropical cyclones have drastically decreased in the last years.No direct deaths were reported as a result of severe tropical cyclone Yasi (2011), even though it was described as one of the most intense cyclones in Australia’s recent history.
Infrastructure
Damage to buildings and infrastructure can result from the impact of wind and water, or through objects the wind propels. Loss of roof cladding, wall cladding, windows and doors is common. This was the case with category 4 Cyclone Tracy, which made landfall at Darwin in 1974. The storm left 94% of housing uninhabitable and approximately 40,000 people homeless.
Ecosystems
The impacts of storms on coral reef ecosystems are well documented. As much as 34% of the coral mortality recorded between 1995 and 2009 in the Great Barrier Reef has been attributed to severe storms (Osborne et al. 2011).
Cyclone Yasi (2011) was responsible for one of the greatest losses of cover in recent years, damaging almost 15% of the entire GBR Marine Park (Beeden et al. 2015).
Rainforest ecosystems are also regularly affected by storms.
How can we better adapt to severe storms?
Australian communities have learned lessons from windstorms events, and there is evidence of successful adaptation. For example, the devastating impacts of Cyclone Tracy (1974) led to modifications to the building codes, and development of world-leading, wind-resistant design and construction practices in Australia (Mason and Haynes 2010).
However, indications that tropical cyclones may become more intense in future, and track further south, suggest a need for further adaptation.