


At a glance
- A robust Monitoring, Evaluation, and Learning (MEL) approach supports adaptation planning by ensuring actions remain effective, relevant, and responsive to changing conditions.
- Tracking trigger thresholds: monitor climate, environmental, and social conditions to identify when predefined thresholds are reached. When triggers are activated, MEL helps interpret their significance and guides transitions to the next action in an adaptation pathway.
- Monitoring performance: tracks how adaptation activities are implemented to provide timely insights that support course correction and improve delivery.
- Evaluating effectiveness: assess whether actions are reducing risk, strengthening resilience, and achieving intended outcomes, while also generating lessons to refine future planning.
- Embedding MEL within an adaptive pathways framework links observed changes directly to decision points and pre‑planned alternatives.
- Aligning with national, regional, or sector guidance strengthens consistency across evaluation and reporting. Identifying appropriate indicators early ensures monitoring is feasible, evaluation is meaningful, and learning occurs throughout the adaptation cycle.
Using MEL to guide effective adaption action
Monitoring, evaluation, and learning (MEL) are core to effective adaptation. MEL provides a structured way to assess whether actions remain relevant, effective, efficient, and sustainable. and it supports continuous improvement as conditions change.
Indicators are central to MEL. Indicators are measurable signals of change, they show whether adaptation objectives are being met and help identify when conditions have shifted enough to require adjusting or shifting to a new action. Indicators support are not just reporting measures or accountability, they inform timely learning and adaptive decision‑making.
It is important to note that, indicators are not the same as the outcomes they represent. An indicator is a signal or proxy that helps us understand what may be happening within a complex system. As a result, indicators are to be used to support discussion, interpretation and judgement, rather than to be considered as definitive measures of success.
Changes in an indicator should prompt questions such as:
- What is changing?
- Why is the change occurring?
- Is the change likely to be temporary or sustained?
- Who is affected?
- What actions, if any, should be taken in response?
- more about the broader MEL process in CoastAdapt's section on Monitoring & Evaluation; selecting effective indicators is just one part of the process.
- more about MEL and how it fits into the adaptation planning cycle in C-CADS.
Trigger indicators
Trigger indicators help identify when an existing adaptation action is no longer sufficient and requires a new or modified action. They signal when conditions in the environment or community have crossed a threshold that makes the current approach ineffective or unsustainable.
To be useful, trigger indicators should reflect real, climate‑driven changes and changing risk rather than short‑term fluctuations or isolated extreme events.
For example, a single erosion event may be part of natural variability. However, repeated and unusually severe erosion events over a short period may indicate that a transition is required to a different adaptation action.
Good triggers are collaborative
Perceptions of risk and acceptable change vary across communities and professional groups, therefore developing trigger indicators should be a collaborative process.
Engaging stakeholders ensures that triggers (or thresholds):
- are meaningful and locally relevant
- reflect social, cultural, environmental and economic values
- account for different risk tolerances
- are more likely to gain support when adaptation decisions are required.
Collaboration should include technical experts but also local communities, Indigenous knowledge holders, asset managers, industry representatives and other affected stakeholders.
Good trigger indicators are timely
Good trigger indicators also provide enough lead-time to plan and implement the next action. They enable decision-makers to:
- undertake detailed assessments
- engage stakeholders
- secure funding
- obtain approvals
- adjust management approaches
- implement the next adaptation action. including engaging stakeholders, securing funding, and adjusting management approaches.
In adaptation pathways, each trigger should be directly linked to a specific next step. This ensures that once a trigger level is reached, decision‑makers can move to a quick review of planned action rather than as an extensive reassessment of options.
Good indicators include multiple sources of knowledge
Trigger indicators are most effective when they are informed by diverse knowledge systems.
Scientific monitoring and modelling provide valuable information about physical changes and future climate risks. Equally important are local observations, lived experience and Indigenous knowledge, which often provide insights into how conditions are changing and what impacts are most meaningful to communities.
Combining different forms of evidence can improve the credibility, relevance and usability of trigger indicators while ensuring that important changes are not overlooked simply because they are difficult to quantify.
Good indicators are now SMARTER, not just SMART
Performance indicators help assess how well an adaptation action is working. They track whether activities are being implemented as intended and whether they are producing meaningful, measurable outcomes.
To be useful. performance indicators need to be carefully chosen so they truly reflect progress toward the goals of the adaptation plan. Traditional guidance suggests they should be SMART (specific, measurable, achievable and attributable, relevant, and time‑bound). They should be straightforward to understand, feasible to measure with available resources, and sensitive to meaningful change over time and aligned with stakeholder priorities.
Recent adaptation practice has expanded the SMART concept to recognise that adaptation occurs in complex and changing systems. Indicators therefore need to support learning, equity, resilience and adaptive management as well as performance measurement.
These enhanced interpretations (SMART+ or SMARTER) encourage indicator sets that:
- capture how institutions are adapting and learning
- reflect locally led and inclusive processes
- align with higher level frameworks such as national or regional or sectors
- remain useful under uncertainty and shifting climate conditions
- support adaptive management and continuous improvement.
Increasingly, indicator sets include measures of:
- institutional capacity
- governance effectiveness
- cross-sector collaboration
- decision-making quality
- community preparedness
- social and environmental resilience.
These indicators help understanding of whether a specific adaptation measure is performing as intended, but also whether the broader enabling environment is becoming more capable of responding to climate risks, and so offer insights into shifts or stagnation.
There is also a shift toward multi‑dimensional indicator sets that integrate biophysical, socio‑economic, cultural, and institutional dimensions to better understand how climate risks and adaptation outcomes evolve over time.
| SMARTER element | Attributes of indicators | Examples |
|---|---|---|
| Specific and Systemic | Precise and capture system-wide dynamics (e.g., governance, institutions, and cross‑sector linkages). | Tracks frequency of high‑tide flooding at critical access points or community assets. Tracks exceedance of drainage system design capacity during extreme rainfall events. Monitors percent loss in vegetation health or density within a defined restoration zone. |
| Measurable and Multi-level | Quantifiable and usable across scales (local, national, global), supporting integration with global adaptation tracking. | Combines local ecological surveys with satellite data. Uses hydrological observations combined with socioeconomic water‑use data. |
| Achievable, Accountable, and Aligned | Feasible, tied to clear responsibility, and aligned with national, regional or sector frameworks | Builds on existing coastal monitoring programs; aligns with emergency management thresholds. Supports SDG and national biodiversity adaptation frameworks. Fits with asset managing systems. Fits with urban flood modelling and existing stormwater asset monitoring. |
| Relevant and Resilience‑Focused | Reflect resilience-building outcomes, institutional capacity, and readiness, not just project outputs. | Signals decreasing performance of grey‑green infrastructure under climate‑driven rainfall changes. Indicates heightened exposure to drought risk under climate change. Indicates heightened exposure to drought risk under climate change. |
| Time‑bound and Transformative | Track progress over clear intervals and reflect whether adaptation is driving meaningful transformation rather than incremental change. | Trigger: “X days/year of access disruption,” for specific beach, prompting escalation to next adaptation pathway step. Trigger: “≥30% canopy decline over two monitoring periods,” activating restoration or hybrid infrastructure. Trigger: “Three climate‑related service interruptions in two years,” requiring redesign, relocation, or protection upgrades in critical infrastructure. |
| Equity‑Centered and Enabling Conditions | Measure inclusion, locally led adaptation, and fairness in process and outcomes. | Protects essential household needs during scarcity. Captures impacts on flood-vulnerable or water-dependent communities, especially those with limited alternatives |
| Reflexive and Learning‑Driven | Support iterative learning, allowing monitoring systems to evolve as climate risks and uncertainties change. | Review after each flooding season to reassess thresholds as sea levels and exposure patterns evolve. Post‑trigger reviews inform whether thresholds remain appropriate under changing climate conditions. Lessons feed into updated stormwater design standards and risk communication. |
Good indicators are fit for purpose for the specific plan
Indicators should be linked and synced to other plans to help support regional, national and sectoral monitoring and learning. However, the primary consideration should always be whether an indicator is useful for the specific adaptation plan, program or decision context, rather than because they are useful for others.
Figure 1 illustrates steps in indicator selection that help to ensure that indicators are appropriate for their intended purpose.
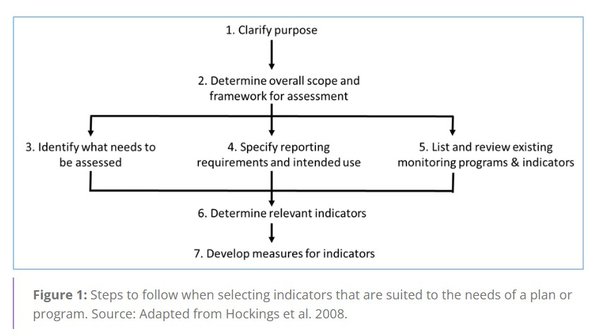
Figure 1. Step to select indicator to suit the needs or a plan or program
- Source: Adapted from Hockings et al. 2008.#905_fig 1
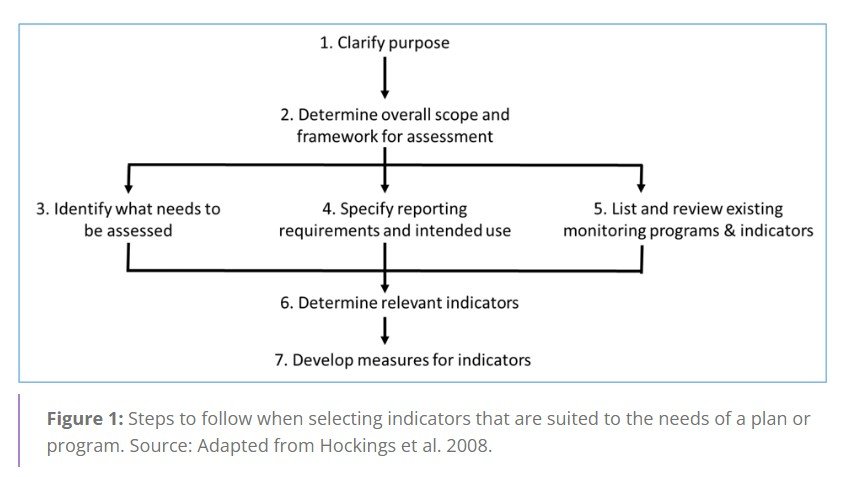
Figure 1. Step to select indicator to suit the needs or a plan or program
Source: Adapted from Hockings et al. 2008.
Attribution
It is important to link indicators to adaptation actions. Attribution can help ensure that any observed changes can be related to that action or, in some cases, that series of actions.
There are many ways in which this can be done. These include development of:
- influence diagrams (e.g. Figure 2)
- causal networks
- conceptual models
- logic models
- theories of change.
These approaches help make explicit any assumptions about cause and effect and improve understanding of how actions are expected to contribute to adaptation outcomes.
However, attribution becomes more difficult with increasingly complex systems. The more complex the system, the more difficult it is to directly attribute the change of an indicator to one or more actions. Many adaptation outcomes are influenced by multiple environmental, social, economic and governance factors operating simultaneously.
It is possible to have short-term indicators that show that a particular action is completed, and yet have long-term indicators that show that actions have resulted in changed outcomes. Demonstrating a direct causal relationship between these long-term outcomes and a specific adaptation action is often challenging and requires careful interpretation of multiple sources of evidence.
For this reason, adaptation monitoring should seek not only to measure change but also to develop a credible understanding of how and why change is occurring.
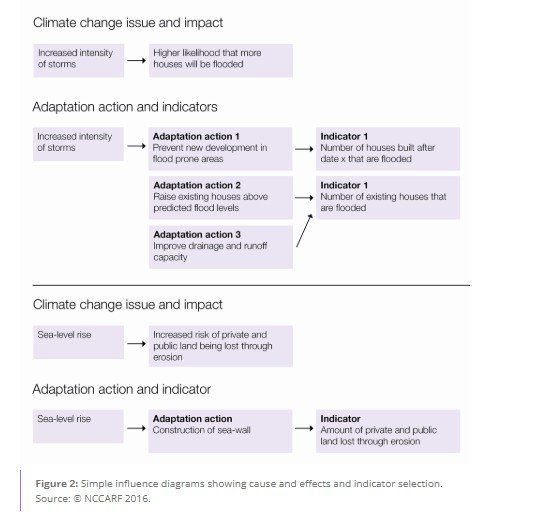
Figure 2: A simple influence diagram that shows cause and effects and indicator selection
#905_fig 2
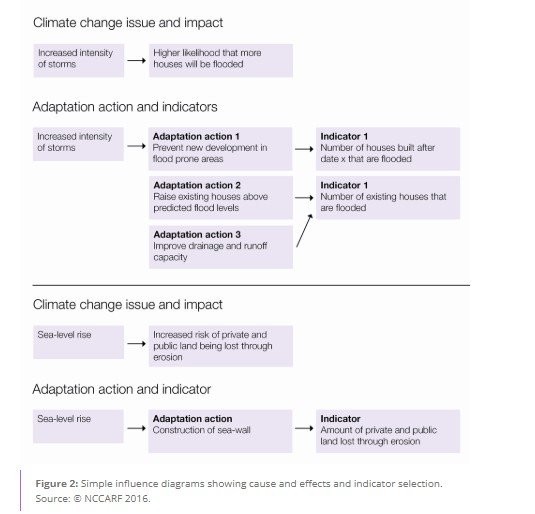
Figure 2: A simple influence diagram that shows cause and effects and indicator selection
Indicators require interpretation
Indicators provide valuable evidence, but they rarely tell a complete story. They usually need context.
Changes in indicator values need to be interpreted in the context of broader system dynamics, external influences and local conditions. In some cases, an indicator may suggest improvement, while other forms of evidence indicate emerging concerns. In other situations, an indicator may change for reasons unrelated to the adaptation action being monitored.
Therefore, indicator results should be reviewed alongside:
- stakeholder perspectives
- local observations
- Indigenous and traditional knowledge
- expert judgement
- qualitative information
- contextual information about broader environmental and societal changes.
Structured reflection and discussion can help ensure that monitoring findings are used to improve understanding and inform future decisions rather than simply being recorded for reporting purposes.
a practical guide, Effective indicators for place-based initiatives, developed by Learning for Sustainability, which provides a practical approach to developing and using indicators in place-based initiatives and policy processes, particularly those involving multiple organisations, communities and knowledge systems.