You are here
Causes of climate change and sea-level rise
CoastAdapt focusses on present-day and future climate change caused by the release of greenhouse gases into the atmosphere from human activities such as industrialisation and land clearance
At a glance
- In CoastAdapt, the focus is on climate change caused by human activities, otherwise known as global warming, or the enhanced greenhouse effect.
- Global warming is caused by the release of greenhouse gases such as carbon dioxide into the atmosphere.
- Greenhouse gases warm the atmosphere, and can cause other effects such as sea-level rise and changes in rainfall and storminess.
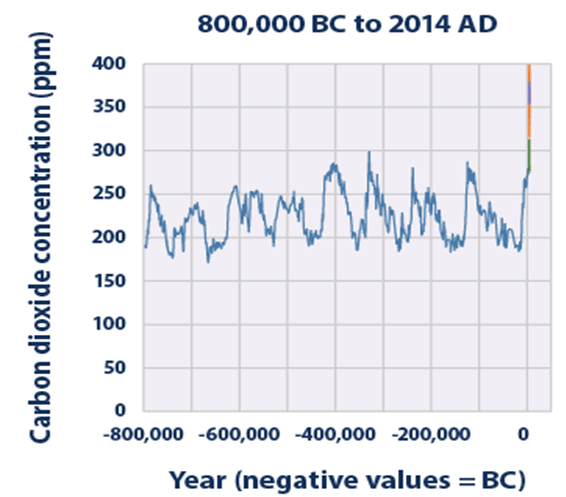
- Current levels of greenhouse gases in the atmosphere are unprecedentedly high.
Main text
In CoastAdapt, the focus is on climate change caused by human activities, otherwise known as global warming, or the enhanced greenhouse effect. Global warming is caused by the release of greenhouse gases such as carbon dioxide into the atmosphere.
What are the greenhouse gases?
In the atmosphere, the principal greenhouse gases are:
- water vapour
- carbon dioxide
- methane
- nitrous oxide
- ozone.
What effect do they have?
- Greenhouse gases are essential to human life – they keep the atmosphere about 33oC warmer than it would be otherwise.
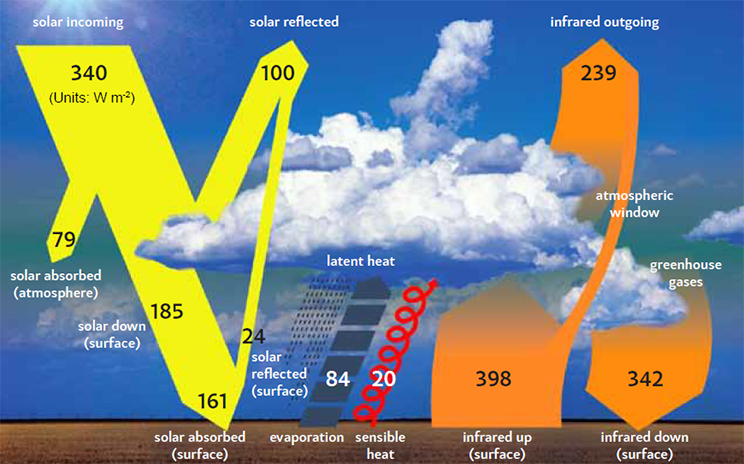
- They do this by selectively absorbing and emitting radiation – they are relatively transparent to shortwave radiation from the Sun, while they absorb long wavelength radiation from the Earth.
Broadly, the wavelength of radiation emitted by an object is inversely proportional to its temperature. So, the Sun is very hot and emits radiation at short wavelengths, the Earth is relatively cool and radiates at much longer wavelengths. The greenhouse gases are transparent to much of the shortwave radiation from the Sun – they allow it to pass through the atmosphere to warm the Earth. Some of the outgoing longwave radiation from the Earth is absorbed by the greenhouse gases, warming the atmosphere and, because some is reradiated towards the Earth, the surface. This is known as the greenhouse effect (see Figure 1).
T2I1_Figure 1.jpg
What are the effects of human activities on greenhouse gas concentrations?
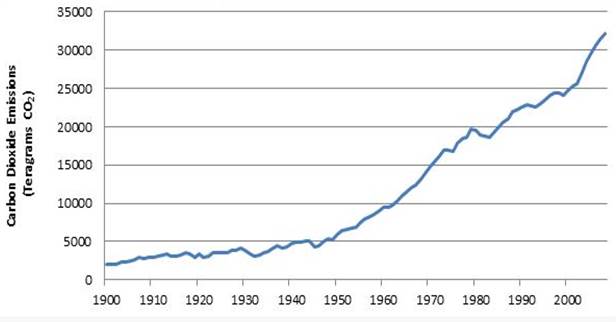
- Since the time of the industrial revolution in the Northern Hemisphere, human activity has added greenhouse gases, especially carbon dioxide, to the atmosphere (see Figure 2).
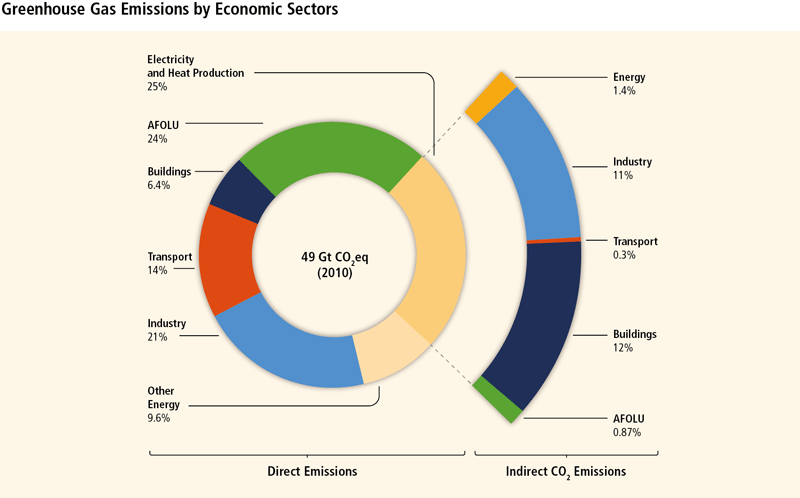
- The main mechanisms are burning of fossil fuels (coal, natural gas and oil), industrial processes and land-use changes (deforestation, land clearing for agriculture, and degradation of soils), see Figure 3.
T2I1_Figure 2.jpg
T2I1_Figure 3.gif
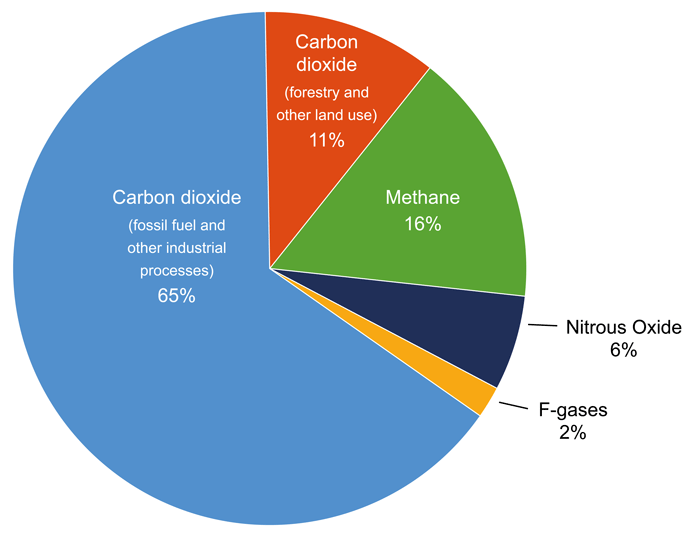
Some greenhouse gases have a greater potential to warm the atmosphere than others – for example, methane is a much more powerful greenhouse gas than carbon dioxide (but because there is less of it in the atmosphere, its overall effect is less than that of carbon dioxide). To compare the contribution of each gas to global warming, they are converted into carbon dioxide equivalents. The idea is to express the impact of each greenhouse gas in terms of the amount of carbon dioxide that would create the same amount of warming (Figure 4).
T2I1_Figure 4.gif
Concentrations of greenhouse gases have varied over very long timescales (many million years). The scale and speed at which humans have added greenhouse gases to the atmosphere since about 1850 means the current atmospheric concentrations of these gases are unprecedented (see Figure 5).
T2I1_Figure-5.gif
What are the effects on climate?
Adding greenhouse gases has little effect on incoming short-wave solar radiation, but increases the amount of outgoing long-wave terrestrial radiation that is absorbed in the lower atmosphere. The result is warming of the lower atmosphere (commonly known as the enhanced greenhouse effect, or global warming). Potentially, there are other effects on our climate also – changes in rainfall distribution and storminess, for example.
What are the effects on the oceans?
Earth’s oceans are warming and sea levels are rising as a result of increasing concentrations of greenhouse gases in the atmosphere. Indeed, around 93 percent of the additional heat created by global warming has so far been absorbed into the oceans.
As water warms, it expands. This expansion has been the major cause of sea-level rise, with a smaller component from land-based glaciers and ice sheets. In the twentieth century, global average sea levels increased by 19 cm. Over time, the contribution from ice melting is expected to increase substantially. For more information see Observed climate and sea-level change.
Are there other effects?
Yes, increasing carbon dioxide may affect plant growth and is affecting the chemistry of the oceans.
First, higher carbon dioxide concentrations increase rates of photosynthesis in plants, and hence growth rates. This has been demonstrated under laboratory conditions. However, in the real world the effect is less clear-cut and depends on a host of other factors including climate change effects on rainfall and temperature, plant type and availability of soil nutrients.
Second, some of the additional carbon dioxide in the atmosphere (around 30-40 percent) dissolves into the oceans, where it decreases the alkalinity of the water (an effect known as Ocean acidification). The effect is at present slight, but will increase in the future unless we take action to reduce carbon dioxide emissions. It has the potential to make it more difficult for some organisms that build shells, such as coral and some plankton, to form calcium carbonate, the material used for shell making. This may contribute to coral bleaching (also affected by increased ocean temperatures). There are knock-on effects for marine food chains and for tourism and fishing industries.
Further information
Source material
Australian Academy of Sciences, 2015: The Science of Climate Change: Questions and Answers. Accessed 29 May 2018. [Available online at https://www.science.org.au/learning/general-audience/science-booklets-0/science-climate-change].
Boden, T. A., G. Marland, R.J. Andres, 2015: Global, regional, and national fossil-fuel CO2 emissions. Carbon Dioxide Information Analysis Center, Oak Ridge National Laboratory, US Department of Energy, Oak Ridge, Tenn., USA.
EPA, 2015: Climate Change Indicators in the United States. Accessed 2 March 2016 [Available online at http://www3.epa.gov/climatechange/science/indicators/ghg/ghg-concentrations.html].
IPCC, 2013: Summary for Policy Makers. In: Climate Change 2013: The Physical Science Basis. Contribution of Working Group I of the Fifth Assessment Report of the Intergovernmental Panel on Climate Change [Stocker, T.F., D. Qin, G.-K. Plattner, M.Tignor, S.K. Allen, J. Boschung, A. Nauels, Y. Xia, V. Bex and P.M. Midgley (eds.)]. Cambridge University Press, Cambridge, United Kingdom and New York, NY, USA. Accessed 2 March 2016 [Available online at https://www.ipcc.ch/pdf/assessment-report/ar5/wg1/WG1AR5_SPM_FINAL.pdf].
IPCC, 2014: Summary for Policymakers, In: Climate Change 2014, Mitigation of Climate Change. Contribution of Working Group III to the Fifth Assessment Report of the Intergovernmental Panel on Climate Change [Edenhofer, O., R. Pichs-Madruga, Y. Sokona, E. Farahani, S. Kadner, K. Seyboth, A. Adler, I. Baum, S. Brunner, P. Eickemeier, B. Kriemann, J. Savolainen, S. Schl.mer, C. von Stechow, T. Zwickel and J.C. Minx (eds.)]. Cambridge University Press, Cambridge, United Kingdom and New York, NY, USA. Accessed 2 March 2016 [Available online at https://www.ipcc.ch/pdf/assessment-report/ar5/wg3/ipcc_wg3_ar5_summary-for-policymakers.pdf].


