You are here
Data and visualisation sources to help understand flood and erosion risk
National mapping and visualisation products are available that can contribute to the assessment of coastal risk under climate change. Most of these products are directly available from CoastAdapt.
At a glance
- National mapping and visualisation products are useful for a first-pass risk assessment to scope local risks and identify if more detailed assessment is required. They can also contribute to second and third-pass risk assessments, along with expert input and more detailed local mapping and data.
- Information on future inundation risk is available from the Coastal Risk Australia tool. Historic flooding can be explored through the Water Observations from Space web service and the Flood Risk Information Portal.
- Information on erosion risk includes the national geomorphology map Smartline, which categorises the coastline by its susceptibility to erosion.
- National mapping of population, infrastructure and buildings is available that can help in identifying assets that might be exposed to inundation or erosion risk.
- Many datasets are directly available from CoastAdapt, together with guidance on their use (see Table 1).
Table 1: Physical coastal datasets available in CoastAdapt's Sea-level Rise and You, and Shoreline Explorer. For guidance of their use, go to Datasets Guidance 1 and Datasets Guidance 2
|
Dataset |
Comments |
|
Inundation risk |
|
|
Sea-level rise projections |
Projected SLR for each coastal local council in Australia up to 2100 |
|
Inundation mapping |
Projected inundation mapping for coastal local councils in Australia with LiDAR, for mid and end-century and two greenhouse gas scenarios |
|
Water observations from space |
An indication of the present-day flooding risk, based on satellite observations |
|
Erosion risk |
|
|
Expert knowledge on coastal compartments |
Qualitative expert description of each secondary compartment on landform, stability etc. |
|
Smartline |
Geomorphology map of the Australian coastline presented as a segmented line tagged with attributes (geology, stability etc.) |
Main text
1. National Coastal Risk Assessment
An initial step in a first-pass risk assessment is to check whether local risks were identified in the 2009 National Coastal Risk Assessment (NCRA). The NCRA drew upon the following national mapping and modelling tools to identify regions most exposed to inundation and long-term erosion risk:
- Digital Elevation Modelling identified height above sea level for each 30 m grid cell
- modelled storm tide information (storm surge plus high tide) provided the basis for constructing realistic flooding scenarios
- coastal geomorphology mapping identified potentially erodible areas
- the National Exposure Information System is a spatial database of buildings and infrastructure.
Using a simple bucket-fill[1] model, the assessment calculated the number of residential buildings exposed to inundation under a 1.1 m sea level rise scenario, and within 55 and 110 m of soft and potentially erodible shorelines. Local Government Areas with the highest number of exposed residential buildings were identified (e.g. see Figure 1). Local protection measures and pipes that could enable sea-water egress were not considered.
T3M1_Figure-1.gif
A supplement to the NCRA was released in 2011 that identified the number of commercial and industrial buildings, and roads and railways, exposed to inundation and erosion risk in each coastal state and territory. The Local Government Areas with the most exposed assets were also identified. Reports on the NCRA can be found at http://www.environment.gov.au/climate-change/adaptation/australias-coasts/national-coastal-risk-assessment (accessed 12 May 2016).
2. National mapping to understand inundation risk
Inundation mapping is available in CoastAdapt here, for a mid-level and high sea-level rise scenario for 2050 and 2100. Those wishing to examine a wider range of sea-level rise scenarios should explore the Coastal Risk Australia tool at http://coastalrisk.com.au/. Guidance on appropriate values of sea-level rise to use can be obtained from here in CoastAdapt, as well as the Climate Change in Australia website. Broadly, your choice depends on your timescales of interest and your appetite for risk.
Mapping of inundation prone areas is also available from some State Governments (see Table 6.3 of the Information Manual 3: Available datasets).
Table 2 identifies national and state-level mapping and visualisation products that are useful for a first pass or more detailed risk assessment. Further information on each of the mapping products follows.
Table 2: National mapping and visualisation products relevant to first pass and more detailed risk assessments of inundation risk.
|
Mapping product |
Use in first pass risk assessment |
Use in more detailed risk assessments |
|
Inundation |
CoastAdapt inundation scenario mapping for each local council |
|
|
Coastal Risk Australia includes inundation scenarios at a range of scales |
Coastal Risk Australia tool allows users to explore inundation from tailored scenarios and local data |
|
|
State government mapping of inundation prone areas |
State government mapping of inundation prone areas |
|
|
Historic flooding |
N/A |
Water Observations from Space uses Landsat satellite images to show past flooding (available from CoastAdapt) |
|
National Flood Risk Information Portal on catchment flooding maps and studies |
||
|
Storm tide |
N/A |
Storm tide height modelling and mapping |
|
Significant wave height modelling and mapping |
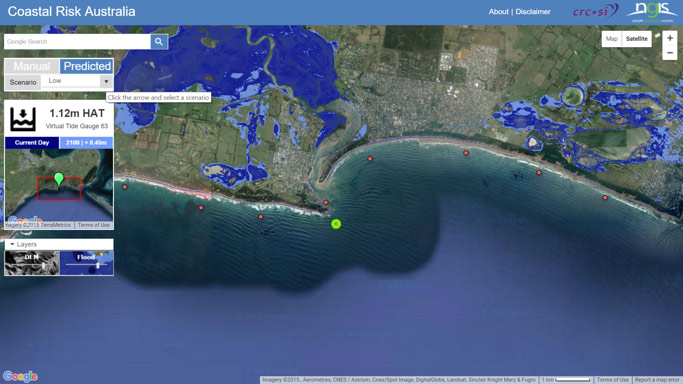
2.1 Coastal Risk Australia
The Coastal Risk Australia tool has been developed by the Cooperative Research Centre for Spatial Information (CRCSI) to communicate the risks of coastal flooding from sea-level rise using Google Earth Engine technology. The tool allows users to simply investigate the extent of inundation from four climate change scenarios using a new 5 m resolution digital elevation model derived from high-resolution airborne LiDAR, and bucket-fill inundation modelling. Areas at risk of inundation under each scenario are shown in light blue. The tool covers the highly developed areas of Australia’s coast, and wherever high-resolution elevation (Lidar) data are available. Figure 2 shows an example of inundation from the tool.
T3M1_Figure-2.jpg
2.2 Water Observations from Space
Water Observations from Space (WOfS) is a web service displaying historical surface water observations derived from satellite imagery for all of Australia from 1987 to present day. The service aims to allow better understanding of where water is usually present, where it is seldom observed and where inundation of the surface has been occasionally observed by satellite. It displays the detected surface water from the Australia-wide Landsat 5 and Landsat 7 satellite imagery archive. If water was observed infrequently in an area, and there is high confidence in that information, then the area is likely to have some risk of flooding. WOfS is available from GEOscience Australia here.
2.3 Australian Flood Risk Information Portal
The Australian Flood Risk Information Portal is relatively new, established following the devastating floods across Eastern Australia in 2011. It aims to provide access to Australian flood information and studies, including data, flood maps, and satellite derived water observations. It also includes guidelines to encourage best practice in the development of new flood risk information. Locations for which flood information is available can be selected by name or from the portal map. While there are few studies in the portal that include climate change scenarios to date, input to the portal depends on stakeholder contributions and will increase over time.
2.4 Storm tide and significant wave mapping
A national map of the 1-in-100 year storm tide height has been developed from hydrodynamic modelling of sea levels from 1949 to 2009, and can be found in the Information Manual 3: Available datasets (see Figure 3.7). The maps shows that the highest storm tides occur on the northwest shelf, as well as across the tropics, Bass Strait and the Great Australian Bight. In other areas, higher wave energy reaches the coast, and Information Manual 3: Available datasets also includes a national map of the 1-in-100 year significant wave height around Australia. Information from these maps is used by experts to inform inundation modelling in more detailed risk assessments.
3. National mapping to understand erosion hazard
A first step is to look at the coastal compartments mapping and information (see Section 3.1 below) in CoastAdapt at link DS6, which provides general information on the sensitivity of a coastal compartment to erosion. Where there is a high level of sensitivity, the Smartline mapping tool can then be accessed (see Section 3.2) to identify the nature of the coastline and the proportion which may be erodible. Smartline is available in CoastAdapt and at www.ozcoasts.org.au (accessed 12 May 2016).
Mapping of erosion prone areas is also available from some State Governments (see Table 6.4 of the Information Manual 3: Available datasets).
Table 3 identifies national and state-level mapping and visualisation products that are useful for a first-pass or more detailed risk assessment. Further information on each of the mapping products follows.
Table 3: National mapping and visualisation products relevant to first-pass and more detailed risk assessments of erosion risk.
|
Mapping product |
Use in first-pass risk assessment |
Use in more detailed risk assessments |
|
Sensitivity to erosion |
Coastal compartments information identifies sensitivity to erosion |
|
|
National Geomorphology Map Smartline identifies where soft and erodible coastlines occur |
Smartline map includes layers of data on the backshore, intertidal and subtidal zones, as well as stability class information |
|
|
Erosion prone areas |
State Government mapping of erosion prone areas |
State Government mapping of erosion prone areas |
|
Aerial photography |
National repository of aerial photography and satellite imagery can show shoreline change over time |
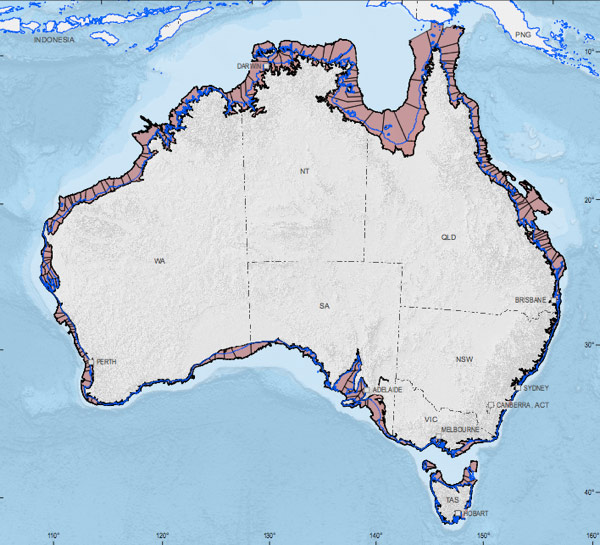
3.1 Coastal compartments
Coastal compartments have been identified around Australia to inform risk and erosion assessments. The compartments are defined by natural coastal landforms, as well as patterns of sediment (for example beach sands) movement. One secondary compartment might be defined as lying between two major headlands, for example.
On their own, coastal compartments are not particularly useful in coastal risk assessment. However, CoastAdapt has gathered the available expert knowledge for each secondary compartment (see Figure 3) on landform, erosion susceptibility, offshore currents, etc. This is provided in Guidance on using expert knowledge on coastal compartments.
T3M1_Figure-3.jpg
3.2 Smartline
Smartline is a national geomorphology map that provides information on the shape of coastal landforms, as well as their underlying geology and composition such as coral, sand, mud, laterite, boulders, and rock types. Smartline was derived from over 200 maps and datasets, and data is presented as a segmented line, tagged with multiple attributes, which can be readily queried and analysed using GIS software.
At its simplest, areas of the coast shown as sandy, muddy, dunes, coarse or fine sediment, or soft rock in a Landform Stability Class search are potentially unstable and susceptible to erosion. Figure 4 shows an example of the data in Smartline. Further information on the use of Smartline for risk assessment is in CoastAdapt at Guidelines for using Smartline.
T3M1_Figure-4.gif
3.3 Aerial photography and satellite imagery
Aerial photography is a key source of information on historic shoreline change, and satellite imagery is a growing resource of increasing high precision mapping. Geoscience Australia maintains a repository of aerial photographs at (http://www.ga.gov.au/scientific-topics/earth-obs/accessing-satellite-imagery/aerial-photography - accessed 12 May 2016), and of Landsat data over all of Australia since 1987 (http://www.ga.gov.au/scientific-topics/earth-obs/satellites-and-sensors/landsat - accessed 12 May 2016). Expert input is generally needed to interpret beach change from aerial photographs.
High resolution imagery of the coast is readily available through such sites as Google Earth and NearMap.
4. National mapping to identify assets at risk
Much information, including mapping and visualisation products, about assets exposed to inundation and erosion risks will be held at local and state scales. Table 4 lists some national mapping products that can assist in a first-pass or more detailed risk assessment. Further information on national datasets on social, economic and environmental assets is in the Information Manual 3: Available datasets (Section 7.2).
Table 4: National mapping products relevant to identification of assets exposed to inundation and erosion risk
|
Mapping product source |
Assets covered |
Description |
|
Buildings and transport infrastructure |
NEXIS is managed by Geoscience Australia and contains spatial location information on residential, commercial and industrial buildings, and transport infrastructure. |
|
|
Range of assets |
The National Map is managed by the Australian Government and includes mapping of infrastructure assets, boundary information, facilities and vegetation types. |
|
|
Population distribution |
Datasets on population distribution and projections at a local scale. |
|
|
Urban infrastructure |
Range of datasets on demography, urban design and housing, health and infrastructure. Datasets are available to universities, and to local governments on request. |
[1] A bucket-fill or bathtub inundation model has only two variables: the water elevation surface and land surface height. The model shows areas at potential risk because they are low-lying. Bucket-fill models do not take account of factors such as sediment supply, offshore geology, engineering structures, rivers, tidal flushing, tidal gates, storm energy and wave forcing, all of which contribute to the shoreline response to sea-level rise. It can underestimate exposure on the open coast as wave setup, wave runup and other dynamic processes that impact water levels are not considered. In some estuaries it can overestimate exposure as estuarine attenuation is not considered. Further information on understanding inundation mapping is in CoastAdapt at Guidelines on using inundation mapping.
Source material
Department of Climate Change, 2009: Climate Change Risks to Australia’s Coasts: A First Pass National Assessment. Department of Climate Change, Commonwealth of Australia. Accessed 12 May 2016. [Available online at http://www.environment.gov.au/system/files/resources/fa553e97-2ead-47bb-ac80-c12adffea944/files/cc-risks-full-report.pdf].
CRCSI (undated): Coastal Risk Australia: Predicted Coastal Flooding Resulting from Climate Change. Accessed 12 May 2016. [Available online at http://coastalrisk.com.au].
Geoscience Australia, 2016: Primary and Secondary Coastal Sediment Compartment Maps. Accessed 12 May 2016. [Available online at https://data.gov.au/dataset/primary-and-secondary-coastal-sediment-compartment-maps].
Sharples, C., R. Mount, and T. Pedersen, 2009: The Australian Coastal Smartline Geomorphic and Stability Map Version 1: Manual and Data Dictionary. Geoscience Australia & Department of Climate Change. Accessed 12 May 2016. [Available online at http://www.ozcoasts.gov.au/pdf/SmartlineV1_DataDictionaryManual_2009_v1_1.pdf].