You are here
Using climate observations to identify local risks
Australia has many readily-available and free sources of present-day and historical climate information and observations. These can be used to make a preliminary assessment of exposure and risk and to determine if further analysis is required.
At a glance
- Australia’s climate is variable and prone to heatwaves, drought, fire and flood. A range of climate observations are available to inform understanding of current climate risk for a local area.
- The Bureau of Meteorology is a key source of historic and current climate data, and state agencies collect, and make available, observational information on tides and waves.
- Other relevant sources of information include Geoscience Australia, for example Water Observations from Space.
- An example is provided for Cairns, Queensland, including where to access available observations and information.
Main text
(All websites named below were accessed on 29 March 2016 and were operational at that time).
Climate observations are useful to help identify current risk
Many parts of the Australian coastline are exposed to episodic tropical cyclones and East Coast Lows, and have been affected by storm surge and extreme wind gusts, as well as king tides. Where these events have occurred at a time and place where records are kept, the information has been captured that can inform understanding of current risk.
The Bureau of Meteorology is the main source of historic and current climate data. The Bureau’s data archives (http://www.bom.gov.au/climate/data-services/) can be searched by text or map to view historical weather observations, statistics, graphs and data for each weather station.
The Bureau of Meteorology also provides information on a number of weather extremes, including tropical cyclones, East Coast Lows, maximum wind gusts and floods. These can be accessed at http://www.bom.gov.au/cyclone/, http://www.bom.gov.au/nsw/sevwx/facts/ecl.shtml, http://www.bom.gov.au/australia/flood/.
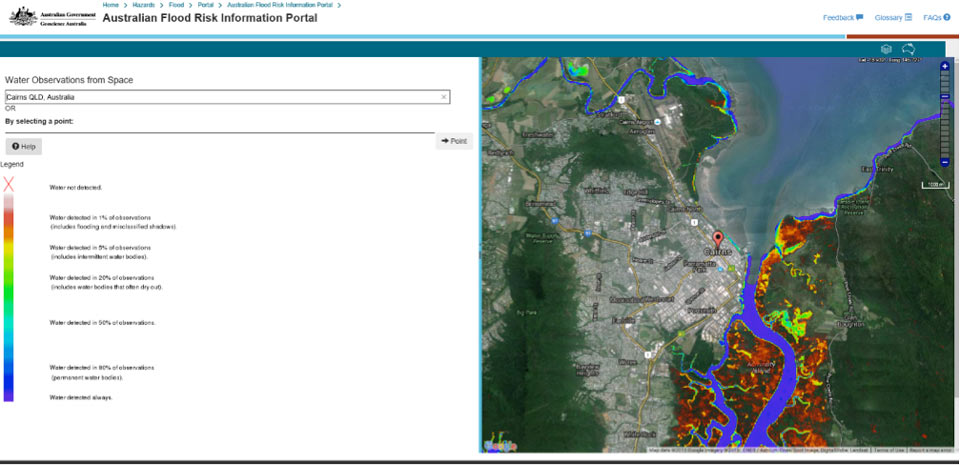
Satellite observations of flooding are available through the Geoscience Australia website ‘Water Observations from Space’ http://www.ga.gov.au/scientific-topics/hazards/flood/wofs. This is a web service displaying historical surface water observations from satellite information for all of Australia from 1987 to the present day. The service aims to help understanding of where water is usually present, where it is seldom observed, and where inundation of the surface has been occasionally observed by satellite. Essentially it is a guide to the probability of flooding based on observational evidence.
State agencies typically collect, and make accessible, observational records of waves and tides. High quality wave data is collected by an array of wave buoys around the Australian coast and includes information on wave height, wave period and, buoys deployed more recently, wave direction. Some of this information is held by the Bureau of Meteorology (e.g. data for Kangaroo Island at http://www.bom.gov.au/products/IDS65030.shtml). Observations on sea levels and tides are also available from state agencies as well as from (http://www.bom.gov.au/oceanography/projects/abslmp/abslmp.shtml) and are managed by the Bureau of Meteorology.
There have also been projects to photographically record the extent of king tides for select events in Australia. The crowd-sourced project by GreenCross, Witness King Tide, generated visual observations of inundation risks in some communities. Photographs from projects can be accessed through www.witnesskingtides.org and see also the snapshot The Witness King Tide Project.
Example of accessing observations to identify local risks – Cairns, Queensland
Following are suggested steps and sources of information on observations to inform an understanding of current climate risk for the city of Cairns, Queensland.
(i) Step 1. Consider the recent climate history of local area, including occurrence of extreme weather events, and identify the range of possible climate risks and the types of climate observations that could be relevant.
The Bureau of Meteorology has summary climate statements for many cities around Australia’s coast. The statement for Cairns is at http://www.bom.gov.au/qld/cairns/climate.shtml which indicates that storms and tropical cyclones occur frequently. Other climate observations that could be useful to inform risks for Cairns include rainfall and rainfall extremes, and sea level, waves and storm tides.
(ii) Step 2. Identify and access key sources of local climate observations that could be relevant to understanding risks. Note that some of this information could be at regional scales.
General monthly statistical information on local climate is available from the Bureau of Meteorology’s website for more than 1000 sites around Australia, including:
- maximum, minimum and ground surface temperatures
- rainfall, including extremes and days of rain above 1 mm, 10 mm, and 25 mm
- other daily elements including sunshine and evaporation where available
- humidity, wind and cloud (nominally) at 9am and 3pm
Information for Cairns is at http://www.bom.gov.au/climate/averages/tables/cw_031011.shtml. The highest and lowest observational records are identified in red and blue for each variable.
The Queensland Government maintains a network of 25 storm tide monitoring sites along the Queensland coastline. The storm tide network allows real-time access to sea-level data during severe weather events to help monitor the impacts of coastal inundation from storm surges. Information for Cairns is at www.qld.gov.au/environment/coasts-waterways/beach/storm-sites/cairns/.
Interpretation of data from weather stations or monitoring sites to determine the potential for climate risks is however not straightforward. It may be useful to access information on weather extremes, seek reports that have synthesised local risks, and/or obtain expert advice.
Accessing extreme event information is also critical to understand the potential magnitude or risk in an area. In particular, tropical cyclones are a key risk for Cairns and regional information on the areas exposed to cyclones is readily available (see, for example, Figure 1).
The Bureau of Meteorology has a range of maps of the spatial locations of cyclones, both collectively as in Figure 1, and showing the track of an individual cyclone. These can be accessed at http://www.bom.gov.au/cyclone/about/
T1WE1_Figure-1.gif
In February 2011, when Tropical Cyclone Yasi crossed the coast near Cardwell, about 150km south of Cairns, storm surges of up to 5.3 m were generated; these help to illustrate the magnitude of risks that might occur in the Cairns region. A Queensland Government report (2012) notes that if the cyclone had made landfall on high tide—just four hours earlier—the water level would have been almost three metres higher. Observations suggest that storm surge magnitudes of up to ten metres need to be considered in local risk assessments for parts of the Queensland coast exposed to cyclones.
Historic information on flood can be accessed through the Geoscience Australia Flood Risk Information Portal at http://www.ga.gov.au/scientific-topics/hazards/flood/wofs. An example for Cairns is shown in Figure 2. This dataset draws on satellite data available since 1987, and shows where water has been detected during the observational period and the percentage of time when the land was wet. Essentially it is a guide to the probability of flooding based on observational evidence.
T1WE1_Figure-2.jpg
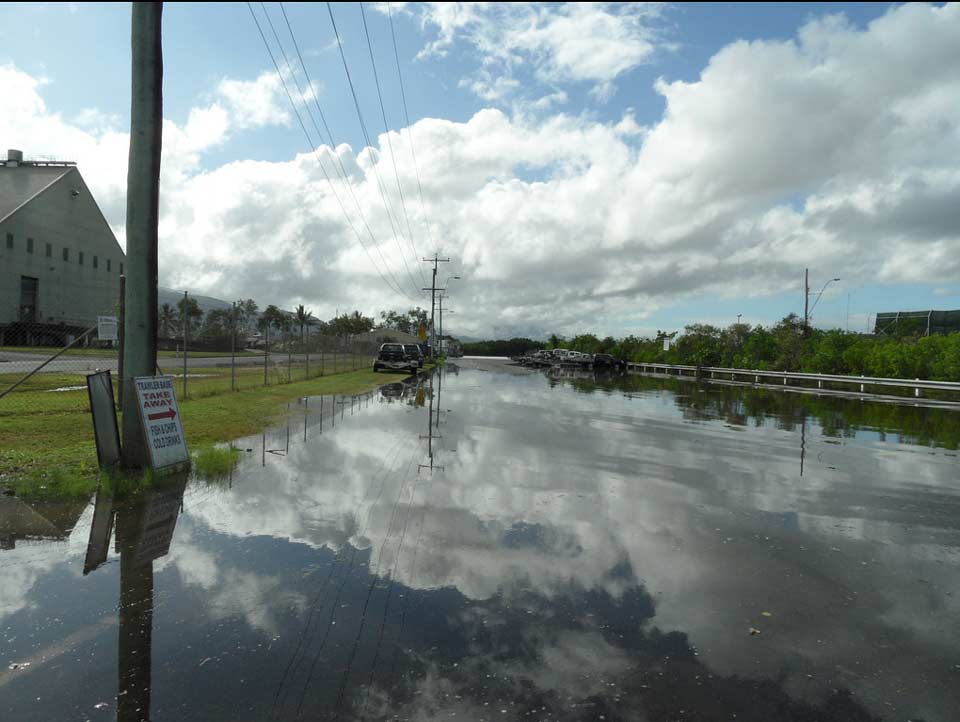
Finally, images of flooding in Cairns can be obtained from the 2012 Witness King Tide project in Queensland (http://www.witnesskingtides.org/media/362164/wkt-publicreport_3mb.pdf). Such a visual record can inform the identification of areas at risk of flooding and assist in communication.
T1WE1_Figure-3.jpg
(iii) Step 3. Integrate climate observations with other information on property, community and residential assets, infrastructure and natural environments of importance, to understand current climate risks to assets.
Fine resolution information on assets is not readily available from national providers. In fact, many coastal managers will have their own sources of information for their area, so that local inquiry may be profitable in the search for local information.
The Australian Geological Survey Organisation (now Geoscience Australia) analysed tropical cyclone and storm tide risk in Cairns and identified inundation risks to buildings, critical facilities and transport infrastructure under current 1-in-100 and 1-in-500 year events (among other scenarios).
T1WE1_Figure4.gif
Accessing existing reports on how observations of climate, particularly extremes, have been considered in risk assessment is useful in understanding how observations can be used. For further information on conducting a risk assessment, see Guidance on risk assessment. Throughout any analysis of climate observations, whether they are being used for risk assessment or some other purpose, it is necessary to take into account the effects of climate change. Our climate is changing, and so past observations are not a complete guide to future conditions, especially when considering longer timescales.
Further information
Bureau of Meteorology websites on climate observations:
Climate data services (multiple variables) http://www.bom.gov.au/climate/data-services/
Gridded maps and data http://www.bom.gov.au/climate/maps/
Water levels http://www.bom.gov.au/waterdata/; http://water.bom.gov.au/waterstorage/awris/
Waves http://www.bom.gov.au/nwp/doc/auswave/data.shtml; www.bom.gov.au/climate/data-services/ocean-data.shtml
Rainfall and runoff http://www.bom.gov.au/australia/flood/; http://www.bom.gov.au/water/designRainfalls/index.shtml
Tropical cyclones http://www.bom.gov.au/cyclone/history/index.shtml
East Coast Lows http://www.bom.gov.au/nsw/sevwx/facts/ecl.shtml; http://reg.bom.gov.au/climate/reg/escci/
CSIRO and Bureau of Meteorology, 2015: Chapter 4 Understanding Recent Australian Climate. In: Climate Change in Australia Information for Australia’s Natural Resource Management Regions: Technical Report. Australia: CSIRO and Bureau of Meteorology. Accessed 29 March 2016. [Available at https://www.climatechangeinaustralia.gov.au/media/ccia/2.1.6/cms_page_media/168/CCIA_2015_NRM_TR_Chapter%204.pdf].
Griffith University. Storm Surge: Know your risk in Queensland! Accessed 29 March 2016. [Available at https://publications.qld.gov.au/dataset/tropical-cyclone-wave-and-storm-tide-reports/resource/32942815-d6fe-48db-bc9a-067fe0d06e84].
Mummery, J., 2016: Available data, datasets and derived information to support coastal hazard assessment and adaptation planning. CoastAdapt Information Manual 3, National Climate Change Adaptation Research Facility, Gold Coast.
Source material
Bureau of Meteorology, 2016: Tropical Cyclone Information for the Australian Region. Accessed 29 March 2016. [Available online at http://www.bom.gov.au/cgi-bin/silo/cyclones.cgi?region=ause&syear=1970&eyear=2004&loc=0].
Geoscience Australia, 2015: Australian Flood Risk Information Portal. Accessed 29 March 2016. [Available online at http://www.ga.gov.au/flood-study-web/#/water-observations].
Granger, K., T.G. Jones, M. Leiba, and G. Scott, 1999: Community Risk In Cairns. A Multi-Hazard Risk Assessment. Australian Geological Survey Organisation, Commonwealth of Australia 1999. Accessed 29 March 2016. [Available at http://www.ga.gov.au/corporate_data/33548/33548.pdf].
Queensland Government, 2012: Tropical Cyclone Yasi - 2011. Post Cyclone Coastal Field Investigation. Queensland Department of Science, Information Technology, Innovation and the Arts, Brisbane, Australia. Accessed 26 April 2017. [Available online at https://publications.qld.gov.au/dataset/tropical-cyclone-wave-and-storm-tide-reports/resource/32942815-d6fe-48db-bc9a-067fe0d06e84].