You are here
Climate change and sea-level rise in the Australian region
Future climate change over Australia will track global trends, causing warmer temperatures, changes to rainfall regimes, rising sea levels and more acidic ocean waters.
At a glance
- Under a high greenhouse gas concentration scenario (RCP8.5), temperatures in Australia will increase by between 2.8 and 5.1°C by 2090 compared to 1986-2005.
- Rainfall trends are more uncertain, however rainfall amounts are expected to decrease over southern Australia, accompanied by more frequent and more severe droughts.
- Global sea levels are expected to increase by 45 to 82 cm by 2090 for the high concentration scenario. These levels may be higher if a tipping point is reached which commits one or more land-based ice sheets to irreversible melting. Projected increases around Australia are very similar.
- Extreme high sea-level events will occur more frequently in future, increasing the risks of flooding and erosion in coastal areas.
- In line with global trends, seawaters around Australia are becoming more acidic, as the oceans absorb some of the CO2 released by human activities.
Main text
Australia’s climate has changed and will continue to change in the future due to increasing concentration of greenhouse gases in the atmosphere. The expected changes are consistent with global trends (see Causes of climate change).
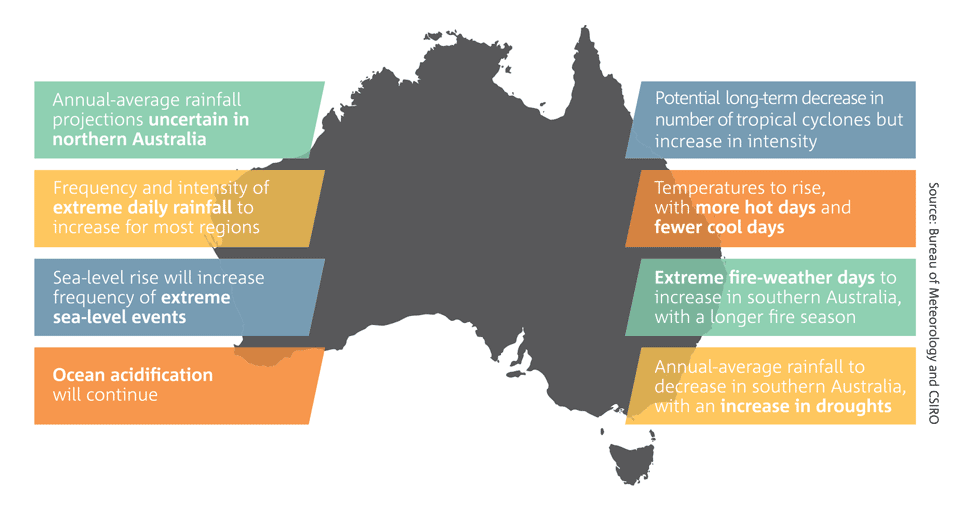
Climate change projections show how the climate may change in the future. For Australia, these projections indicate (Figure 1):
- a warmer atmosphere (with more hot days and fewer cold days)
- a warmer and more acidic ocean
- higher sea levels
- changes in rainfall patterns
- more frequent and intense extreme rainfall events
- fewer but more severe tropical cyclones.
T2I4_Figure-1.gif
Changes in temperature
Climate projections indicate that Australia is heading for a much warmer future (Figure 2). The magnitude of warming will depend on how societies, globally, will live in the future. Will economies be carbon intensive? Will population growth decline? Answers to these questions determine whether atmospheric concentrations of greenhouse gas in future will be high, or will start to decline, and so in turn the amount of warming that will take place. Scenarios of future greenhouse gas concentrations are constructed and used to explore future climate change.
If a ‘high concentration’ scenario (RCP8.5, for an explanation see Understanding climate scenarios and the infographic What are the RCPs?) is followed, by 2090 Australia could warm by as much as 2.8°C to 5.1°C above the climate of 1986-2005. This level of warming is slightly higher than the global average warming of 2.6°C to 4.8°C projected by the Intergovernmental Panel on Climate Change (IPCC) in its Fifth Assessment Report. However, if emissions are lower (RCP4.5), then the temperature increase will be lower, at around 1.4°C to 2.7°C.
T2I4_Figure-2.gif
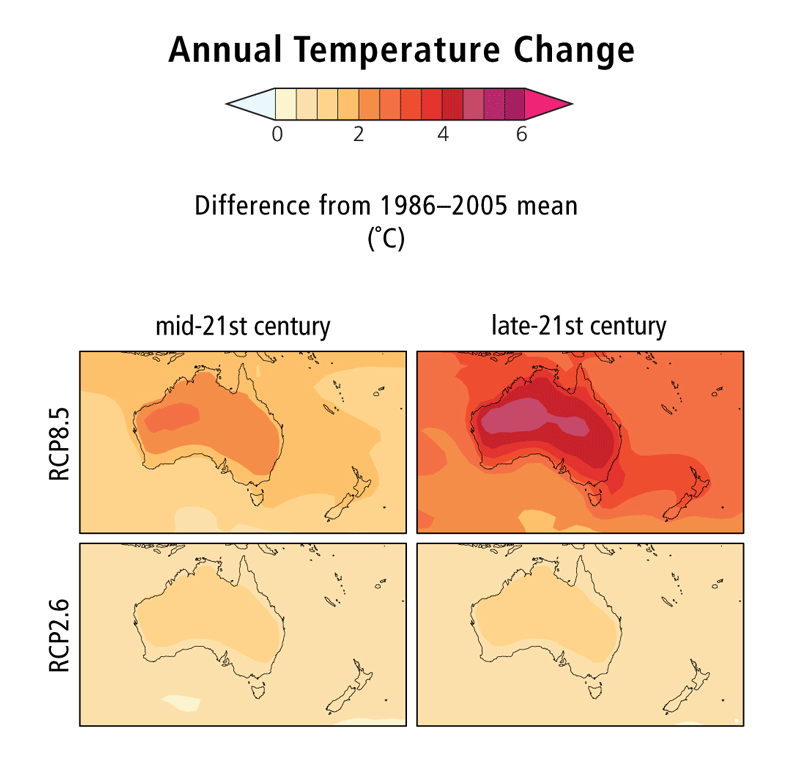
Changes in temperature will not be regionally uniform across Australia. In general, inland areas are expected to warm faster than coastal areas. Warming along the coasts will be lower in the south and during winter. For example, temperatures for the south Australian coast (e.g. Adelaide) warm by 2.4 to 3.9°C by 2090 under a high concentration scenario, whilst Darwin, on the north coast, is projected to warm by 2.8 to 5.1°C (Webb and Hennessy, 2015). Table 1 shows projections of temperature changes for the whole of Australia and four regions (CSIRO and Bureau of Meteorology 2015).
|
2030 RCP4.5 |
2090 RCP2.6 |
2090RCP4.5 |
2090 RCP8.5 |
|
|
Australia |
0.9 (0.6 to 1.3) |
1.0 (0.6 to 1.7) |
1.9 (1.4 to 2.7) |
4.1 (2.8 to 5.1) |
|
Northern Australia |
0.9 (0.6 to 1.3) |
0.9 (0.5 to 1.6) |
1.7 (1.3 to 2.6) |
3.7 (2.7 to 4.9) |
|
Rangelands |
1.0 (0.6 to 1.4) |
1.1 (0.6 to 1.8) |
2.1 (1.5 to 2.9) |
4.3 (2.9 to 5.3) |
|
Eastern Australia |
0.9 (0.6 to 1.2) |
1.0 (0.6 to 1.6) |
1.9 (1.3 to 2.6) |
3.9 (2.8 to 5) |
|
Southern Australia |
0.8 (0.5 to 1) |
0.9 (0.5 to 1.4) |
1.7 (1.2 to 2.1) |
3.5 (2.7 to 4.2) |
Table 1: Projected temperature change (oC) for Australia and regions with the confidence interval (10th and 90th percentile) given in brackets. Source: CSIRO and Bureau of Meteorology 2015.
There is more information on climate change and sea-level rise around Australia in Information Manual 2: Understanding sea-level rise and from the Climate Change in Australia website (link). For help in interpreting this information see Understanding climate scenarios.
Changes in precipitation
Projected changes in precipitation (rainfall and snowfall) are still uncertain for many parts of Australia. This is because rainfall is very variable in space and in time, and because the processes that build clouds and generate rainfall are small-scale—smaller than the grid used to simulate future climate change in most global climate models. As a result, these models do not simulate changes in precipitation as well as they do changes in temperature.
However, climate models consistently agree that rainfall will decrease over much of southern Australia, with the greatest confidence that this will happen for the south-west. Indeed, the decline of precipitation in southwestern Australia during winter could be as great as 50% under the high concentration scenario RCP8.5 by 2090 (CSIRO and BoM, 2015). This decline in precipitation is thought to be associated with circulation changes in the southern hemisphere due to increasing greenhouse gases and reductions in stratospheric ozone. The decline is expected to increase the frequency and severity of droughts over southern Australia, most severely in the southwest.
In eastern Australia the trend towards lower rainfall is less clear. Up to around 2030, natural variability is expected to dominate over any trend due to global warming. For later in the century (around 2090), models do indicate a trend towards lower rainfall, but with lower certainty than in the southwest.
Changes in extreme events
Extreme events in Australia (heatwaves, droughts, bushfires, floods, cyclones etc.) are expected to change in their frequency and severity in the future as a result of climate change. Projected changes include the following.
- Heatwaves will become more intense, more frequent and of longer duration (e.g. the number of days above 35oC will increase in all major Australian cities – see Table 2).
- Heavy rainfall events, and associated flooding, are likely to occur more frequently throughout most of Australia (although this is less likely for southwestern Australia, where the large projected reduction in rainfall is more likely to suppress the tendency for more intense rainfall).
- The number of days of severe fire danger is likely to increase in southern and eastern Australia.
- Extreme high sea-level events are very likely to become more common because of increases in regional sea level together with changes in other climate change-related events (e.g. changes to wave direction and height, as well as storm surge).
- Tropical cyclones may occur less often but those that do occur are expected to become more intense, and may track further south (see Cyclone and ECL impacts).
- Frosts will become rarer in areas where they used to occur, especially along the coast.
|
City |
Current |
2030 RCP4.5 |
2090 RCP4.5 |
2090 RCP8.5 |
|
Adelaide |
20 |
26 (24 to 29) |
32 (29 to 38) |
47 (38 to 57) |
|
Brisbane |
12 |
18 (15 to 22) |
27 (21 to 42) |
55 (37 to 80) |
|
Canberra |
7.1 |
12 (9.4 to 14) |
17 (13 to 23) |
29 (22 to 39) |
|
Darwin |
11 |
43 (25 to 74) |
111 (54 to 211) |
265 (180 to 322) |
|
Hobart |
1.6 |
2.0 (1.9 to 2.1) |
2.6 (2.0 to 3.1) |
4.2 (3.2 to 6.3) |
|
Melbourne |
11 |
13 (12 to 15) |
16 (15 to 20) |
24 (19 to 32) |
|
Perth |
28 |
36 (33 to 39) |
43 (37 to 52) |
63 (50 to 72) |
|
Sydney |
3.1 |
4.3 (4.0 to 5.0) |
6.0 (4.9 to 8.2) |
11 (8.2 to 15) |
Table 2: Average present-day and future annual number of days above 35°C for selected cities, with a confidence interval (10th and 90th percentile) given in brackets. Source: Webb and Hennessy 2015, where further information is provided.
The marine environment is also experiencing high temperature events, known as ‘marine heat waves’. The marine heat wave experienced along the west coast of Australia during the summer of 2011, when water temperatures 2 to 4°C warmer than usual led to fish and invertebrate deaths, changes in species abundance and distributions, and variations in catch rates, shows how dangerous these events can be for marine ecosystems. As global warming continues into the future, these events will occur more often.
Changes in sea level
Sea levels are rising globally and around the Australian coastline and will continue to rise through this century and beyond. Consistent with global increases, sea levels have risen in Australia at an average rate of 2.1 mm/year over the past half century.
Projections of sea-level rise for Australia show that the rate of rise during the 21st century will be greater than over the past four decades for all concentration scenarios. As shown in Figure 3, the projected amount of regional sea-level rise is largest for RCP8.5 and smallest for RCP2.6 (the lowest concentration scenario).
T2I4_Figure-3.jpg
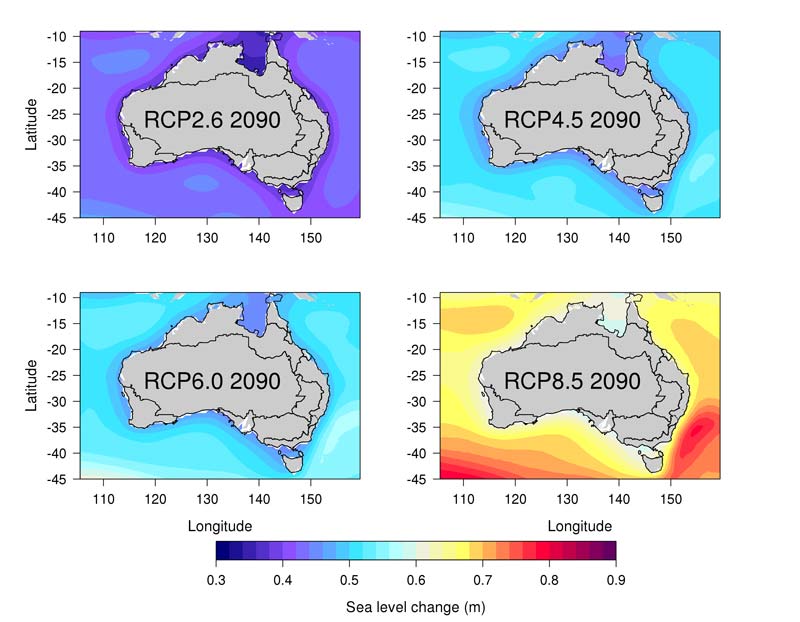
Sea-level rise projections for Australian coast by the end of the century are similar to, or slightly larger than (by up to about 6 cm) figures for the global average increase (see Global climate change). The likely estimate of sea-level rise in Australia by 2090 is about 45-82 cm higher than 1986-2005 levels. This figure could be higher if a tipping point is reached in the global system which commits land-based ice sheets, such as the Greenland ice sheet, to irreversible melting. Such an event has a low but not zero probability and therefore cannot be ignored. The consequences would be catastrophic—total melting of the Greenland ice sheet would contribute 6 m to global sea levels, but this would take many centuries to occur. According to the IPCC, ‘only the collapse of marine-based sectors of the Antarctic ice sheet, if initiated, could cause global mean sea level to rise substantially above the likely range during the 21st century. This potential additional contribution cannot be precisely quantified but there is medium confidence that it would not exceed several tenths of a meter of sea level rise during the 21st century’ (Church et al. 2013).
Projected sea-level rise for major Australian coastal cities is shown in Table 3. In general, there are small differences in average sea-level rise between locations. Models suggest that sea-level rise off the south-eastern coast of Australia will be greater than the global average (Church et al. 2009). Coastal capital cities such as Brisbane, Darwin, Perth, Adelaide and Sydney show an average increase of 60 – 66 cm by 2090 for RCP8.5 (high concentration scenario) and 45 – 47 cm for RCP4.5 (medium concentration scenario). However, the likely range of change is wider, for example from 38 cm to 89 cm across these cities for RCP8.5.
|
City |
2030 RCP 4.5 |
2090 RCP 4.5 |
2090 RCP 8.5 |
|
Adelaide |
0.12 (0.08 to 0.16) |
0.45 (0.28 to 0.63) |
0.60 (0.39 to 0.83) |
|
Brisbane |
0.13 (0.09 to 0.18) |
0.47 (0.31 to 0.65) |
0.65 (0.45 to 0.87) |
|
Darwin |
0.12 (0.08 to 0.16) |
0.47 (0.30 to 0.65) |
0.62 (0.41 to 0.85) |
|
Hobart (Spring Bay) |
0.13 (0.09 to 0.18) |
0.48 (0.31 to 0.66) |
0.66 (0.45 to 0.89) |
|
Melbourne (Stony Point) |
0.11 (0.07 to 0.16) |
0.44 (0.27 to 0.62) |
0.59 (0.38 to 0.81) |
|
Perth (Fremantle) |
0.12 (0.07 to 0.16) |
0.46 (0.28 to 0.65) |
0.61 (0.39 to 0.84) |
|
Sydney |
0.13 (0.09 to 0.18) |
0.47 (0.30 to 0.65) |
0.66 (0.45 to 0.88) |
Table 3: Sea-level projections (in m) for 2030 under the intermediate (RCP4.5) concentration scenario, and for 2090 under the intermediate (RCP4.5) and high (RCP8.5) concentration scenarios with the confidence interval (10th and 90th percentile) given in brackets. Source: Webb and Hennessy 2015.
When planning for the coastal zone, it is important to take into account not only projected sea-level rise, but also its combination with extreme events such as windstorm and associated storm surge. Changes in extremes are captured by the calculated allowances (see Table 4). The allowance is the height that coastal defences would need to be raised in order to provide the same level of protection as they do today.
|
City |
2050 RCP 4.5 |
2090 RCP 4.5 |
2090 RCP 8.5 |
|
Adelaide (Port Adelaide) |
0.25 |
0.59 |
0.81 |
|
Darwin |
0.23 |
0.52 |
0.71 |
|
Melbourne (Stony Point) |
0.20 |
0.51 |
0.70 |
|
Perth (Fremantle) |
0.24 |
0.56 |
0.76 |
|
Sydney |
0.26 |
0.59 |
0.84 |
|
Townsville |
0.24 |
0.53 |
0.74 |
Table 4: Projected allowances (in m) for 2050 under the intermediate (RCP4.5) concentration scenario, and for 2090 under the intermediate (RCP4.5) and high (RCP8.5) concentration scenarios for selected cities along the Australian coastline. Source: CSIRO and Bureau of Meteorology 2015.
Large-scale systems such as El Niño can also affect sea levels over timescales of a few years, for example sea levels rise around Australia during El Niño and fall during La Niña events. The occurrence of El Niño and La Niña events (their frequency and severity) will be affected by climate change, with knock-on implications for sea-level rise.
Changes in the ocean
Ocean waters around Australia are expected to warm because of climate change, and to become more acidic because of the addition of CO2 to the atmosphere due to human activities (known as the ‘direct effect’). The magnitude of change, in both cases, depends on the rate of emissions growth.
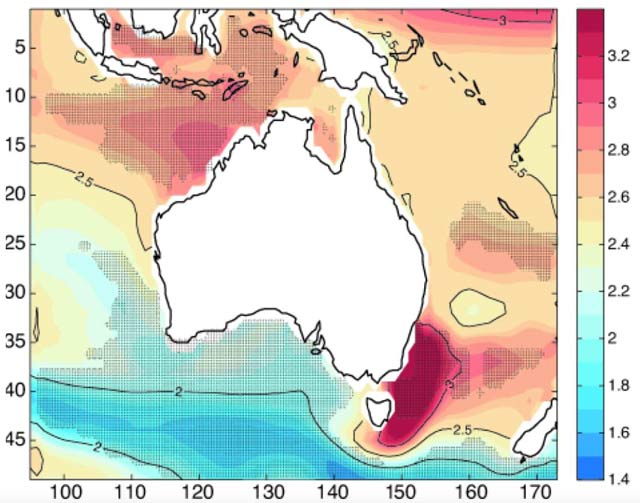
Ocean temperature near the Australian coast could rise about 0.4-1°C by 2030 under RCP4.5, and around 2-4°C under RCP8.5 by 2090. However, regional differences in the magnitude of warming are expected (see Figure 4), including (Lough et al. 2012):
- greatest warming (>3.2°C) off south-eastern Australia, including the eastern coast of Tasmania
- relatively large warming (2.8 – 2.9°C) off north-western Australia
- slower rates of warming (less than 2.2°C) in southern waters
- warming of around 2.5°C off the northeast Australian coast (encompassing the Great Barrier Reef and Coral Sea).
T2I4_Figure-4.jpg
Globally, seawater could increase its acidity by 170% by the end of the century if the RCP8.5 concentration scenario is followed. Regional projections for Australia are currently not reliable (Hobday and Lough 2011). More acidic ocean conditions prevent some marine organisms, such as coral and some plankton, from forming and maintaining their shells and skeletons. The impacts could extend up the food chain, affecting Australian fisheries, aquaculture and tourism (see Ocean acidification).
Looking beyond 2100
Climate change will not cease by the end of the century, simply because the majority of global and regional projections only extend to that date. Warming will continue beyond 2100 for all RCP scenarios except RCP2.6, and sea-level rise will continue for all scenarios.
Even if we suddenly stopped emitting greenhouse gases, warming and in particular sea-level rise would continue for many decades if not centuries. This is because of the ‘climate commitment’, due primarily to the role of the oceans in climate change. Because ocean water can move vertically, and so store heat at depth, it takes the oceans many decades to adjust to warming at the surface and achieve a new equilibrium. This means that some of the atmospheric warming and ice melt due to increased greenhouse gases emissions is delayed, also by decades.
Source material
Bureau of Meteorology, 2014: State of Climate 2014. Bureau of Meteorology and CSIRO. Melbourne, Australia. Accessed 1 June 2016. [Available online at http://www.bom.gov.au/state-of-the-climate/].
Church, J.A., N.J. White, J.R. Hunter, K. McInnes, and W. Mitchell, 2009: Sea level. In: A Marine Climate Change Impacts and Adaptation Report Card for Australia 2009. [Poloczanska E.S., A.J. Hobday, and A.J. Richardson (Eds.)]. Accessed 8 January 2018. [Available online at https://www.nccarf.edu.au/userfiles/Report_card_websmall.pdf].
Church, J.A., and Coauthors, 2013: Sea Level Change. In: Climate Change 2013: The Physical Science Basis. Contribution of Working Group I to the Fifth Assessment Report of the Intergovernmental Panel on Climate Change, Stocker, T.F., D. Qin, G.-K. Plattner, M. Tignor, S.K. Allen, J. Boschung, A. Nauels, Y. Xia, V. Bex and P.M. Midgley, Eds., Cambridge University Press, Cambridge, United Kingdom and New York, NY, USA. Accessed 1 June 2015. [Available online at https://www.ipcc.ch/pdf/assessment-report/ar5/wg1/WG1AR5_Chapter13_FINAL.pdf].
CSIRO and Bureau of Meteorology, 2015: Climate Change in Australia Information for Australia’s Natural Resource Management Regions: Technical Report, CSIRO and Bureau of Meteorology, Australia. Accessed 29 May 2018. [Available online at https://www.climatechangeinaustralia.gov.au/en/publications-library/technical-report/].
Hobday, A.J., and J.M. Lough, 2011: Projected climate change in Australian marine and freshwater environments. Marine and Freshwater Research, 62(9), 1000-1014.
IGBP, IOC, and SCOR, 2013: Ocean Acidification: Summary for Policymakers–Third Symposium on the Ocean in a High-CO2 World. International Geosphere-Biosphere Programme. Stockolm, Sweden. Accessed 1 June 2016. [Available online at http://www.igbp.net/download/18.30566fc6142425d6c91140a/1385975160621/OA_spm2-FULL-lorez.pdf].
Lough, J., A.S. Gupta, A.J. Hobday, 2012: Temperature. In: A Marine Climate Change Impacts and Adaptation Report Card for Australia 2012, Poloczanska E.S., A.J. Hobday, and A.J. Richardson, Eds., Accessed 1 June 2016. [Available online at
Reisinger, A., R.L. Kitching, F. Chiew, L. Hughes, P.C.D. Newton, S.S. Schuster, A. Tait, and P. Whetton, 2014: Australasia. In: Climate Change 2014: Impacts, Adaptation, and Vulnerability. Part B: Regional Aspects. Contribution of Working Group II to the Fifth Assessment Report of the Intergovernmental Panel on Climate Change, Barros, V.R., C.B. Field, D.J. Dokken, M.D. Mastrandrea, K.J. Mach, T.E. Bilir, M. Chatterjee, K.L. Ebi, Y.O. Estrada, R.C. Genova, B. Girma, E.S. Kissel, A.N. Levy, S. MacCracken, P.R. Mastrandrea, and L.L. White, Eds, Cambridge University Press, Cambridge, United Kingdom and New York, NY, USA, pp. 1371-1438. Accessed 1 June 2016 [Available online at https://www.ipcc.ch/pdf/assessment-report/ar5/wg2/WGIIAR5-Chap25_FINAL.pdf].
Webb, L.B. and Hennessy, K.,2015: Projections for selected Australian cities, CSIRO and Bureau of Meteorology, Australia. Accessed 1 June 2016 [Available online at https://www.climatechangeinaustralia.gov.au/media/ccia/2.1.6/cms_page_media/176/CCIA_Australian_cities_1.pdf].

