You are here
How to access climate change scenarios
Scenarios of future climate change for use in impact and adaptation studies are available from a number of national and state-level providers.
At a glance
Information from climate models is available and can be used to understand climate change risks and to plan for a climate-affected future.
- There are a range of scenarios of future climate change available to support decision makers to understand future climate risk in their area.
- In selecting the most appropriate scenario, factors to consider are: the time period, the year of interest, the variables, and the underlying greenhouse gas emissions pathway.
- While the scenarios may not be detailed, and may not be specific to your area, there should be sufficient information available to determine the risk from climate change and to start planning for a climate-affected future.
- There may be uncertainties associated with scenario information, but this should not be seen as a barrier. Risk management frameworks such as the Coastal Climate Adaptation Decision Support Framework (C-CADS) can guide climate adaptation planning.
Main text
Adaptation decision makers can use scenarios of future climate change to understand the risks they need to plan for – what they are, how severe they are, when and where they are likely to be most severe. These scenarios are generally constructed from the output of three-dimensional climate models. An explanation of these models is provided in Understanding climate scenarios which we recommend you read before proceeding further.
Accessing scenarios and climate model data
Climate model data and scenarios constructed from these data can be obtained from a number of national (mainly from CSIRO and the Bureau of Meteorology) and regional sources (mainly from state and territory governments). Table 1 provides details and links to websites.
All states
| Projections program | Climate Change in Australia (2015) |
| Developer | CSIRO and Bureau of Meteorology |
| Emission scenarios | RCP2.6, 4.5, 6.0 and 8.5 (also B1, A1B and A2 SRES scenarios) |
| Future time periods | 14 time periods: 2025, 2030, 2035,…2090) |
| Models and resolution | Up to 40 General Circulation Models (GCMs) for the RCPs, up to 18 GCMs for SRES; RCMs, as well as statistical downscaling |
| Variables | Monthly, 3-monthly, 6-monthly and annual changes in up to 14 climate variables |
| Output | http://www.climatechangeinaustralia.gov.au/en/climate-projections/climate-futures-tool/introduction-climate-futures/ |
| Projections program | Consistent climate scenarios project (2012) |
| Developer | Department of Science, Information Technology, Innovation (Queensland Government) |
| Emission scenarios | Six SRES scenarios and two stabilisation scenarios (450 and 550ppm) |
| Future time periods | 2 time periods: 2030 and 2050 |
| Models and resolution | 19 GCMs are statistically downscaled at a 25 km by 25 km resolution |
| Variables | Daily data for 6 variables |
| Output | https://www.longpaddock.qld.gov.au/climateprojections/about.html |
NSW and ACT
| Projections program | AdaptNSW (NARCliM) (2011) |
| Developer | University of New South Wales |
| Emission scenarios | SRES high emissions scenario (A2) |
| Future time periods | 2 time periods: 2020-2039 and 2060-2079 |
| Models and resolution | 4 GCMs dynamically downscaled using 3 Regional Climate Models (RCMs) to 10 km resolution |
| Variables | 11 variables, some at hourly resolution |
| Output | http://climatechange.environment.nsw.gov.au/Climate-projections-for-NSW |
Tasmania
| Projections program | Climate Futures for Tasmania (2010-2012) |
| Developer | Joint project between state government and Antarctic Climate and Ecosystems CRC |
| Emission scenarios | SRES A2 and B1 |
| Future time periods | 3 time periods 2010-2039; 2040- 2069, and 2070-2099 |
| Models and resolution | subset of CMIP3 |
| Variables | |
| Output | http://www.dpac.tas.gov.au/divisions/climatechange/climate_change_in... |
South Australia
| Projections program | SA Climate Ready (2011) |
| Developer | Goyder Institute |
| Emission scenarios | RCP4.5 and 8.5 |
| Future time periods | 20-year time periods centred on 2030 (2020-2039), 2050 (2040-2059), 2070 (2060-2079) and 2090 (2080-2099) |
| Models and resolution | 6 ‘best’ GCMs statistically downscaled to 27 weather stations in South Australia |
| Variables | Daily data for 6 variables |
| Output | http://goyderinstitute.org/index.php?id=14 |
Queensland
| Projections program | Consistent climate scenarios project (2012) |
| Developer | Department of Science, Information Technology, Innovation (Queensland Government) |
| Emission scenarios | Six SRES scenarios and two stabilization scenarios (450 and 550 ppm) |
| Future time periods | 2 time periods: 2030 and 2050 |
| Models and resolution | 19 GCMs are statistically downscaled at a 25 km by 25 km resolution |
| Variables | Daily data for 6 variables |
| Output | https://www.longpaddock.qld.gov.au/climateprojections/about.html |
Western Australia
| Projections program | Indian Ocean Climate Initiative (IOCI) (2011) |
| Developer | WA Government, CSIRO and BoM |
| Emission scenarios | SRES scenarios B1, A1B, A2 |
| Future time periods | 2 time periods: Mid-century (2047-2064) and end-of-century (2082-2099) |
| Models and resolution | 5 global circulation models (GCMs) are statistically downscaled for south-west WA (29 sites) and north-west WA (9 Kimberley sites and 10 Pilbara sites). |
| Variables | Daily rainfall and maximum and minimum temperature |
| Output | http://www.ioci.org.au/ |
Table 1: Climate change projection data sources in Australia
Things to consider when using model data for adaptation
1. How much experience do you have?
Some of the sites in Table 1 provide more guidance to users than others. If you are just starting to think about adaptation, then the websites that provide lots of initial guidance will be more useful. The Climate Change in Australia website has a large amount of information and guidance on every aspect of using climate models and scenarios for the less-experienced user.
2. Do you want a scenario, or climate model data?
T2M2_Figure-1.gif
Some websites will provide you with a visual representation of future climate change – for example, a simple map, as shown in Figure 1. Or there are publications that provide useful information about future climate change, such as the data in Table 2, from Webb and Hennessy (2015) and available on the Climate Change in Australia website.
Table 2: Average current and future annual number of days above 35oC for selected cities, with a confidence interval given in brackets (10th and 90th percentile) (Webb and Hennessy 2015, which provides further information).
|
Threshold |
Current |
2030 RCP4.5 |
2090 RCP4.5 |
2090 RCP8.5 |
|
Adelaide |
20 |
26 (24 to 29) |
32 (29 to 38) |
47 (38 to 57) |
|
Brisbane |
12 |
18 (15 to 22 |
27 (21 to 42) |
55 (37 to 80) |
|
Canberra |
7.1 |
12 (9.4 to 14) |
17 (13 to 23) |
29 (22 to 39) |
|
Melbourne |
11 |
13 (12 to 15) |
16 (15 to 20) |
24 (19 to 32) |
|
Perth |
28 |
36 (33 to 39) |
43 (37 to 52) |
63 (50 to 72) |
|
Sydney |
3.1 |
4.3 (4.0 to 5.0) |
6.0 (4.9 to 8.2) |
11 (8.2 to 15) |
Some websites provide model data as a basis for further analysis – for example to use as input data to impact models. Sometimes this is tailored to the needs of particular users, such as SA Climate Ready, which focuses on providing data for hydrological impact research and, in particular, for input to hydrological models.
For many purposes, a simple map or table is sufficient to understand the risk and to start a community consultation process. For other purposes, the user will need data. In this case, you need to make decisions about what future dates you are going to look at, whether you require monthly or daily data, which climate parameters you need (rainfall, maximum or minimum temperature etc.) and what future scenario of increases in greenhouse gases you will use. Everything becomes much more complex, so that it is best to use ready-made information wherever possible, and unless your requirement is for very detailed and specialised information.
3. Timescales and scenarios
Climate models combine both natural variability and anthropogenic increases in greenhouse gas emissions to arrive at a projection of future climates. You need to look across an average of at least 10 years, and some would say 20 years is preferable to get a realistic picture of the future. (If you only look at one model year, you are unlikely to get a realistic picture of the future – it might be a particularly unusual year with a very strong El Niño for example.) Most of the sites listed in Table 1 provide information for blocks of years, usually at least a decade.
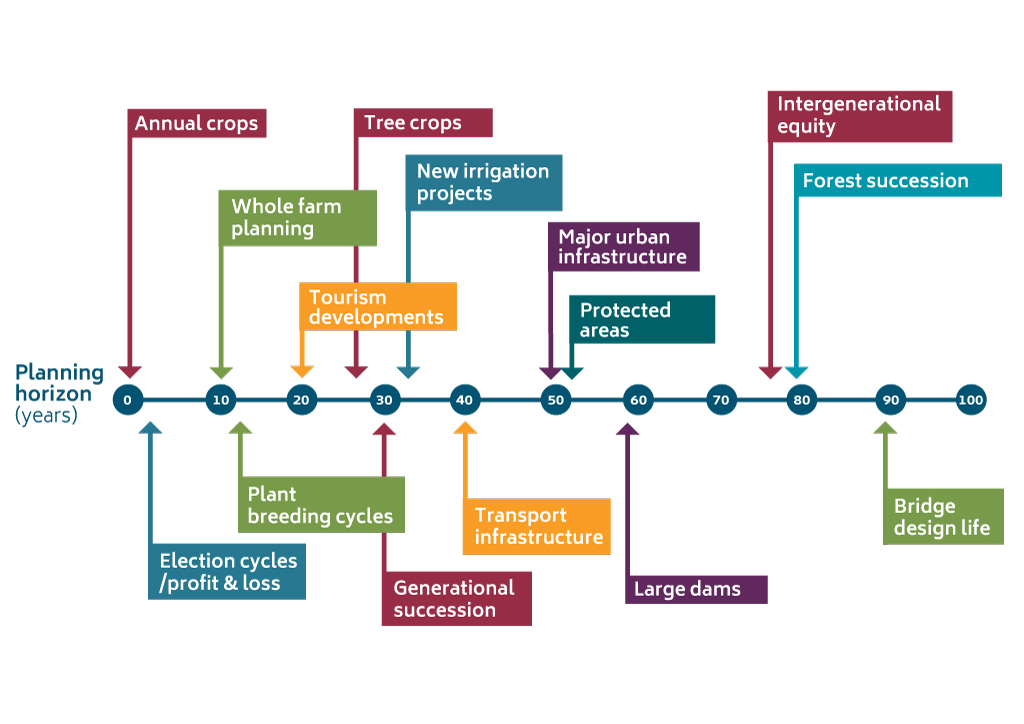
You need to decide what time period you want to look at. One reason for your selection is the timescales of the issue you are seeking to address. If you are looking at climate change risks for very long lifetime infrastructure such as power stations, you will be interested in the later decades of this century (note that none of the model simulations in Table 1 go beyond 2100). For shorter-term problems, you may want to look at the mid century. Any earlier than that, you will probably not be able to distinguish any climate change signal from the noise of natural variability. Figure 2, taken from the Climate Change in Australia website, shows typical planning horizons for different sectors.
T2M2_Figure-2.jpg
Climate model experiments are performed by increasing the concentrations of greenhouse gases in the model atmosphere year by year and then observing how the climate changes in response. The most recent scenarios of greenhouse gas concentrations are called the Representative Concentration Pathways or RCPs, and these are described in Understanding climate scenarios. You have to decide which RCP you are interested in. If you are looking at the first half of the century up to about 2050, the RCP you choose does not have very much effect on the climate model data – you don’t get much divergence in the climates of the RCPs until the latter part of the century. If you are interested in the later decades up to 2100, then the choice you make is important. Advice is provided in Understanding climate scenarios.
It is possible that climate change could be even more extreme (or indeed less extreme) than the models show when using the RCP scenarios. The climate may behave in unexpected ways that are not captured by the models. The sudden collapse of a large ice sheet such as the West Antarctic Ice Sheet could lead to more rapid sea-level rise than anticipated in current models. These are low probability but potentially high impact events. There are no model simulations available that provide future climate scenarios for Australia for such events – expert judgement is the best approach to take. If you have a very high value or strategic piece of infrastructure to plan for, it would be worth considering what the impact of a catastrophic change in the climate or sea level might mean for it.
In summary, things you need to consider when selecting your future climate change scenario are:
- For short to medium planning horizons, the choice you make has little effect on the outcome as the scenarios have not strongly diverged. A high greenhouse gas concentrations scenario (RCP8.5) will ensure you have covered the worst case, and most models are run with this RCP, so there is plenty of data to choose from, allowing you to explore the effects of different model sensitivities if you wish to do so.
- If developing infrastructure which may have very long lifespans (ports, airports) you may wish to consider the worst case scenario RCP8.5.
- However, if time and resources permit, it is a good idea to explore the climates of more than one RCP. Global emissions are currently following the pathway of RCP8.5. It is reasonable to expect that the effects of international negotiations will cause emissions to reduce, so that the ultimate outcome may be RCP6.0 or even RCP4.5.
- Whatever scenario you select, there is potential for futures that are more extreme than projected. See more information on Climate change surprises.
Further information
The Climate Change in Australia website offers guidance and training in using model data. In particular, it has a useful section on Common Mistakes When Using Model Data http://www.climatechangeinaustralia.gov.au/en/support-and-guidance/using-climate-projections/common-mistakes.
For further information within CoastAdapt please refer to Understanding climate scenarios and Communicating local scenarios.
Source material
Jones R.N., and K.L. McInnes, 2004: A scoping study on impact and adaptation strategies for climate change in Victoria. Report to the Greenhouse unit of the Victorian Department of Sustainability and Environment. CSIRO Atmospheric Research, Melbourne, Australia.
NSW Government, 2016: AdaptNSW Climate projections for NSW. Accessed 2 March 2016. [Available online at http://www.climatechange.environment.nsw.gov.au/climate-projections-for-nsw].
Webb, L.B. and K. Hennessy, 2015: Projections for selected Australian cities, CSIRO and Bureau of Meteorology, Australia. Accessed 2 March 2016. [Available online at