You are here
Global climate change and sea-level rise
Climate and sea levels are changing as a result of human activity and will continue to change into the future.
At a glance
- Earth’s climate has changed over the past century due to the unprecedented scale and speed at which greenhouse gases have been added to the atmosphere by human activities.
- Even if all emissions from human activities suddenly stopped, the climate would continue to change. This is because the oceans, which store heat, take many decades to adjust.
- Under a scenario with high atmospheric greenhouse gas concentrations (RCP8.5), we estimate that global temperatures by 2081-2100 will increase by between 2.6 and 4.8°C compared to 1986-2005. Under a low greenhouse gas scenario (RCP2.6) the increase is between 0.3 and 1.7°C.
- Warming is expected to be accompanied by changes in extreme events including more severe heatwaves, storminess, droughts and floods.
- Global sea levels have risen and will continue to rise. We estimate that the increase by 2081-2100, compared to 1986-2005, will be 45-82 cm for the high greenhouse gas scenario, and 26-55 cm for the low greenhouse gas scenario.
- Extreme high sea level events will occur more frequently in future, increasing the risks of flooding and erosion in coastal areas.
- Ocean waters are becoming more acid due to increases in CO2, and this trend will continue.
Main text
Earth’s climate has changed in the past and will continue to change in response to the addition of greenhouse gases to the atmosphere as a result of human activities (Read more about Causes of climate change).
Future climate changes are expected to include a warmer atmosphere, a warmer and more acidic ocean, higher sea levels, changes in rain and snowfall patterns and changes in the frequency and severity of extreme events. These changes are expected to have impacts on ecosystems, coastal systems, fire regimes, food and water security, health, infrastructure and human security.
Global changes in temperature
Computers models that simulate the climate system make it possible to estimate future changes in global temperatures (see Understanding climate scenarios). Changes over the course of the 21st century are summarised in Table 1.
|
|
2046-2065 |
2081-2100 |
|||
|
|
Scenario |
Mean |
Likely range |
Mean |
Likely range |
|
Global Mean |
RCP2.6 |
1.0 |
0.4 to 1.6 |
1.0 |
0.3 to 1.7 |
|
RCP4.5 |
1.4 |
0.9 to 2.0 |
1.8 |
1.1 to 2.6 |
|
|
RCP6.0 |
1.3 |
0.8 to 1.8 |
2.2 |
1.4 to 3.1 |
|
|
RCP8.5 |
2.0 |
1.4 to 2.6 |
3.7 |
2.6 to 4.8 |
|
|
|
Scenario |
Mean |
Likely range |
Mean |
Likely range |
|
Global Mean |
RCP2.6 |
0.24 |
0.17 to 0.32 |
0.40 |
0.26 to 0.55 |
|
RCP4.5 |
0.26 |
0.19 to 0.33 |
0.47 |
0.32 to 0.63 |
|
|
RCP6.0 |
0.25 |
0.18 to 0.32 |
0.48 |
0.33 to 0.63 |
|
|
RCP8.5 |
0.30 |
0.22 to 0.38 |
0.63 |
0.45 to 0.82 |
|
Table 1: Projected change in global mean surface air temperature and global mean sea-level rise for the 21st century relative to the reference period 1986-2005. Source: IPCC 2013 (Fifth Assessment Report, Working Group 1, Summary for Policy Makers, Table 2).
By 2081-2100, projections show increases in the range 0.3°C to 4.8°C relative to the period 1986-2005. The range is broad because changes in temperature are estimated for four different greenhouse gas scenarios. These are the Representative Concentration Pathways (RCPs), explained in Understanding climate scenarios. Following the high scenario RCP8.5 could lead to a global average warming of 2.6°C to 4.8°C by the end of the century, whereas if we reduce our emissions to follow the RCP6.0 pathway or better, the temperature increase, and the associated changes in our climate, will be lower.
Figure 1 shows how global temperatures are expected to change over the 21st century for two of the RCPs, the high greenhouse gas scenario RCP8.5, and the low scenario RCP2.6.
T2I2_Figure-1.gif
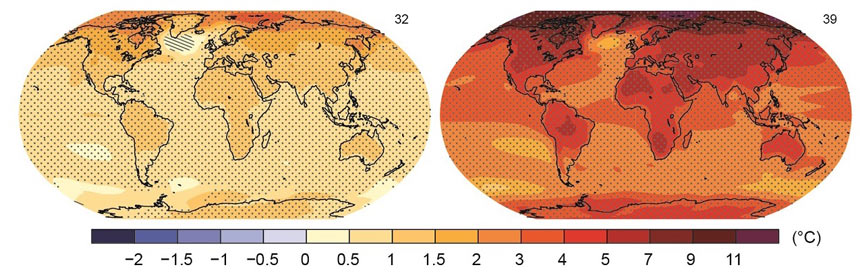
Changes in temperature will not be regionally uniform. Some parts of the world will experience larger temperature increases than others. Figure 2 shows maps of the change in temperature expected by 2081-2100 for RCP2.6 and RCP8.5. The warming is greatest over continents and at high latitudes, especially in the Northern Hemisphere.
The reason why warming is greatest at high latitudes is because of ice melt. The highly reflective ice surface is replaced by a darker soil surface which absorbs more sunlight, leading to more warming and more melting – a positive feedback. The effect is less over Antarctica where very low present-day temperatures limit the amount of ice melt expected to occur with the projected warming by 2100.
Warming is greatest over the continents primarily because there is no mechanism, such as ocean currents, to take the heat away from the surface.
T2I2_Figure-2.jpg
Avoiding ‘dangerous’ climate change
Limiting global warming to no more than 2°C, and possibly a lower threshold, has become the policy target to avoid future dangerous climate change. The 21st Conference of the Parties of the United Nations Framework Convention on Climate Change (UNFCCC) in 2015 led to the Paris Agreement, which states:
“This Agreement … aims to strengthen the global response to the threat of climate change … by … holding the increase in the global average temperature to well below 2oC above pre-industrial levels and to pursue efforts to limit the temperature increase to 1.5oC above pre-industrial levels” Paris Agreement Article 1
Table 1 and Figure 1 show that an increase of at least 2°C is expected for both the medium-high greenhouse gas scenario (RCP6.0, orange in Figure 1) and high greenhouse gas scenario (RCP8.5, red in Figure 1). Only RCP2.6 meets the policy target of 2oC at 2100 with any certainty.
Global changes in precipitation
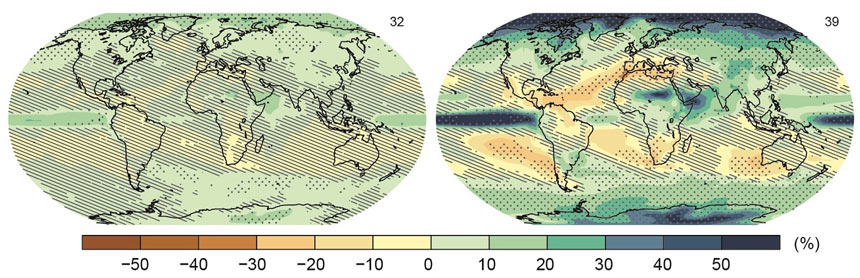
Changes in precipitation (rainfall and snowfall) are much more difficult for climate models to simulate than temperature. This is because rainfall is more variable in space and in time, and because the processes that build clouds and cause rainfall are small-scale (smaller than the grid square of a climate model, explained in Understanding climate scenarios). Figure 3 shows maps of model estimates of future precipitation change.
Figure 3 shows that, under RCP8.5, high latitudes and the equatorial Pacific Ocean are likely to experience an increase in annual mean precipitation by 2100. In many mid-latitude and subtropical dry regions, mean precipitation will likely decrease, whereas many mid-latitude wet regions will see an increase by the end of the century. Under RCP2.6 the changes are generally small, less than 10 percent.
T2I2_Figure-3.jpg
Global changes in sea level
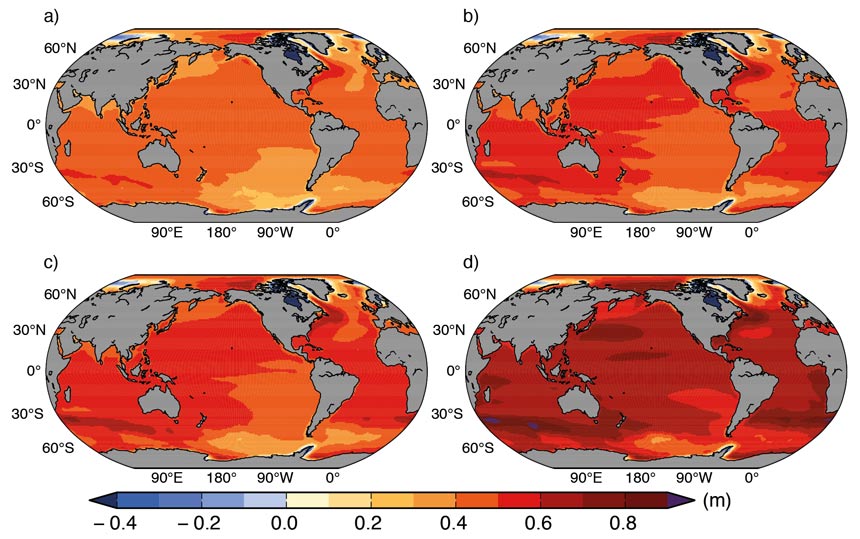
Sea level has risen by about 19 cm since the early 20th century and will continue doing so for centuries, even if greenhouse gas emissions are dramatically reduced. The IPCC Fifth Assessment estimates for future sea-level rise are shown in Table 1 and Figure 4. These indicate, by 2081-2100, a global average increase in sea level of 26-55 cm for RCP2.6, and 45-82 cm for RCP8.5 (compared to 1986-2005 levels).
The major causes of sea-level rise are warming of the oceans causing thermal expansion of seawater, together with loss of ice from glaciers and ice sheets. These two explain about 87% of the observed rise since the early 1970s (39% from thermal expansion, 48% from ice loss). Looking forward, increasing contributions are expected from melting of the Greenland and Antarctic ice sheets. (For more technical details see the Information Manual: Understanding sea-level rise).
T2I2_Figure-4.gif
The change in sea level that is experienced at a particular place is influenced by factors in addition to global sea-level rise. These include the geology of the coast (how soft the sediments are, and how prone to erosion) as well as isostatic adjustment – the vertical movement of the land in response to loading and unloading due to processes such as erosion, deposition, water loading, desiccation, ice accumulation, and deglaciation. Large-scale systems such as El Niño events can also affect sea levels over timescales of a few years, for example sea levels rise during El Niño and fall during La Niña around Australia.
T2I2_Figure-5.jpg
Changes in extreme events
Extreme events (heatwaves, droughts, floods and windstorms etc.) will change in their frequency and severity in future as a result of climate change. Some expected changes (in order of decreasing confidence) include the following.
- Heatwaves will become more intense, more frequent and of longer duration.
- Extreme high sea level events are very likely to become more common, through a combination of sea-level rise and storm surge.
- Heavy rainfall events, and associated flooding, are likely to occur more frequently, especially in the mid-latitudes and wet tropical regions.
- The intensity and duration of droughts are likely to increase.
- Intense tropical cyclone activity may become more common in the western North Pacific and North Atlantic.
Looking beyond 2100
Temperature increases will not cease in 2100, simply because the majority of graphs such as Figure 1 only go to that date. Warming is projected to continue beyond 2100 under all RCP scenarios except RCP2.6.
Even if we suddenly stopped emitting greenhouse gases, warming and sea level rise would continue for many decades. This is because of the climate commitment, due primarily to the role of the oceans in climate change. Because ocean water can move vertically and so store heat at depth, it takes the oceans many decades to adjust to warming at the surface and achieve a new equilibrium. This means that some of the atmospheric warming, ice melt and thermal expansion of the oceans due to increased greenhouse gases emissions is delayed, also by decades.
Further information
Link to a good video about sea level rise developed by Harden Up (a Green Cross Australia project):
 https://www.youtube.com/watch?v=thjGcpYROIg
Source material
Church, J.A., P.U. Clark, A. Cazenave, J.M. Gregory, S. Jevrejeva, A. Levermann, M.A. Merrifield, G.A. Milne, R.S. Nerem, P.D. Nunn, A.J. Payne, W.T. Pfeffer, D. Stammer, and A.S. Unnikrishnan, 2013: Sea level change. In: Climate Change 2013: The Physical Science Basis. Contribution of Working Group I to the Fifth Assessment Report of the Intergovernmental Panel on Climate Change [Stocker, T.F., D. Qin, G.-K. Plattner, M. Tignor, S.K. Allen, J. Boschung, A. Nauels, Y. Xia, V. Bex and P.M. Midgley (eds.)]. Cambridge University Press, Cambridge, United Kingdom and New York, NY, USA. Accessed 2 March 2016. [Available online at http://www.ipcc.ch/pdf/assessment-report/ar5/wg1/WG1AR5_Chapter13_FINAL.pdf].
Church, J. A., and N.J. White, 2011: Sea-level rise from the late 19th to the early 21st century. Surveys in Geophysics, 32, 585-602.
IPCC, 2013: Summary for Policy Makers. In: Climate Change 2013: The Physical Science Basis. Contribution of Working Group I of the Fifth Assessment Report of the Intergovernmental Panel on Climate Change [Stocker, T.F., D. Qin, G.-K. Plattner, M.Tignor, S.K. Allen, J. Boschung, A. Nauels, Y. Xia, V. Bex and P.M. Midgley (eds.)]. Cambridge University Press, Cambridge, United Kingdom and New York, NY, USA. Accessed 2 March 2016 [Available online at https://www.ipcc.ch/pdf/assessment-report/ar5/wg1/WG1AR5_SPM_FINAL.pdf].
Wong, P.P., I.J. Losada, J.-P. Gattuso, J. Hinkel, A. Khattabi, K.L. McInnes, Y. Saito, and A. Sallenger, 2014: Coastal systems and low-lying areas. In: Climate Change 2014: Impacts, Adaptation, and Vulnerability. Part A: Global and Sectoral Aspects. Contribution of Working Group II to the Fifth Assessment Report of the Intergovernmental Panel on Climate Change [Field, C.B., V.R. Barros, D.J. Dokken, K.J. Mach, M.D. Mastrandrea, T.E. Bilir, M. Chatterjee, K.L. Ebi, Y.O. Estrada, R.C. Genova, B. Girma, E.S. Kissel, A.N. Levy, S. MacCracken, P.R. Mastrandrea, and L.L. White (eds.)]. Cambridge University Press, Cambridge, United Kingdom and New York, NY, USA, pp. 361-409. Accessed 2 March 2016. [Available online at https://www.ipcc.ch/pdf/assessment-report/ar5/wg2/WGIIAR5-Chap5_FINAL.pdf].