You are here
How climate and sea level have changed over the long-term past
This web content was produced by Jonathan Nott, College of Science and Engineering, James Cook University
Please cite as:
Nott, J. F. 2016: How climate and sea level have changed over the long-term past. CoastAdapt, National Climate Change Adaptation Research Facility, Gold Coast.
Climate and sea levels change over timescales from decades to millions of years, in response to a number of forcings of which anthropogenic climate change is one.
At a glance
- Climate and sea levels change over timescales from decades to millions of years, in response to solar variations, changes in the Earth’s orbit around the Sun, volcanic eruptions, movement of the continents and natural variability.
- Since the start of the industrial revolution, humans have been adding greenhouse gases to the atmosphere and this is causing the Earth-atmosphere-ocean system to warm – an additional cause of climate change.
- The effects of climate change have been large, particularly over long timescales. Sea levels were between 100 m and 200 m higher than present about 110 million years ago, and 120 m lower than present about 20 000 years ago. Temperatures were up to 8 oC higher than present about 40 million years ago and approximately 4 – 6 oC cooler during the Last Glacial Maximum (LGM) about 20 000 years ago.
- It doesn’t take much forcing to have a big effect. Only slight variations in the energy from the Sun caused the shift between glacial and interglacial states during the Quaternary. Once a trend begins, it is magnified by positive feedbacks. For example, once ice begins to melt and expose the soil and rock beneath, the darker colours of the surface absorb more radiation and so accelerate the warming effect.
Main text
Climate changes on all timescales in response to natural forcings – opening statement
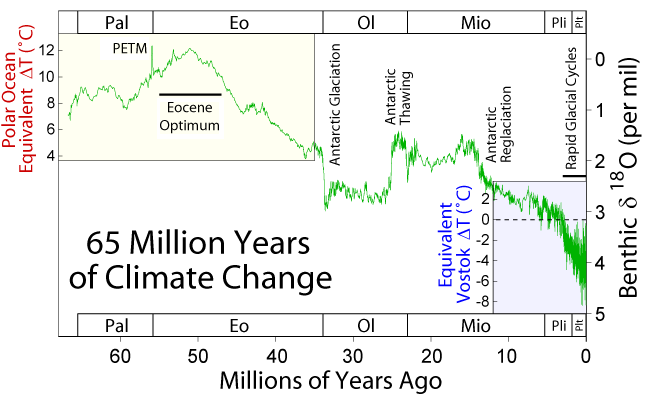
Climate and sea levels change over timescales ranging from decades, centuries and millennia to millions of years. Over the longer timescales temperatures have varied by as much as 10oC and sea levels have oscillated by hundreds of metres (Figure 1). These variations tend to be less as the timescale reduces. Sea levels for example were at least 100 m and maybe over 200 m higher than present about 110 million years ago and 20 000 years ago they were 120 m lower than present (Williams et al. 1993; Miller et al. 2005). Temperatures were possibly up to 8 oC higher than present during the Eocene (about 40 million years ago) (Figure 2) and approximately 4 – 6 oC cooler during the Last Glacial Maximum (LGM) about 20 000 years ago.
T1I3_Figure 1.png
What are the forcings? Continental drift, Solar cycles, Milankovitch, volcanoes, and different timescales of these.
Over the past 100 million years the movement of Earth’s tectonic plates has resulted in the majority of the landmasses converging towards the north geographic pole, while Antarctica has located over the south geographic pole. This has resulted in the increasing persistence of snow and ice over larger areas of the Earth for longer periods throughout each year. These plate movements also resulted in changes in the behaviour of ocean currents and the rise of mountain chains, which affected airflow allowing cold air from the poles to penetrate further equatorward. As a result climate over the past 60 million years has gradually cooled, by approximately 20 oC in the polar regions (Zachos et al. 2001).
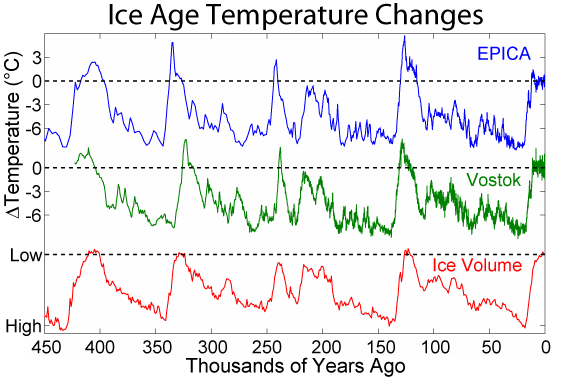
The most dramatic increase in ice cover started approximately 2.7 million years ago at the beginning of the Quaternary period. Since then the Earth has experienced numerous periods when ice sheets have expanded and contracted. These periods are known as glacials and interglacials, respectively. It is uncertain exactly why these episodes began but it is most likely associated with the movement of landmasses toward and over the poles, the construction of mountain ranges such as the Himalayas and also possibly volcanic eruptions whose particulate matter in the atmosphere helped to partially shield the Sun’s energy. Between 2.7 million years ago and approximately 800 000 years ago these ice ages occurred every 41 000 years. After this they occurred every 100 000 years.
T1I3_Figure 2.png
The occurrence of glacials and interglacials is governed by regular variations in the Earth’s orbit around the Sun (Box 1):
- the eccentricity of the orbit, with a periodicity of around 100 000 years
- the obliquity or tilt of the Earth’s axis - between 24.5 and 22.1 degrees (periodicity 41 000 years)
- the position that the north geographic pole points, resulting in a precession of the equinoxes (periodicity 23 000 years) (Wiliams et al. 1993, Zachos et al. 2001).
These regular orbital oscillations result in variations in the amount of solar energy received by the Earth as shown in Figure 3.
T1I3_Figure-3.gif
T1I3_Figure 4.png
Box 1: Orbital parameters
Orbital parameters affect the amount of insolation received by the Earth at various times. Eccentricity (with periods of 400 000 and 100 000 years) has the least effect on insolation despite it being the main periodicity for glacials and interglacials (since 800 000 years ago). A high angle of tilt (41 000 yr cycle) increases the seasonal contrast resulting in colder winters and warmer summers in both hemispheres and Precession (23 000 yr cycle) increases the seasonal contrast in one hemisphere while decreasing it in the other (Figure 4).
How do we know? Evidence from natural archives.
Variations in climate can be preserved as a range of distinct signatures in ice cores, lake and ocean bottom and terrestrial sediments, limestone stalagmites, corals and tree rings to name just a few of the types of natural archives (Box 2):
- sediments preserve the remains of small animals and plants and various minerals and chemicals that record water and air temperatures and rainfall variations
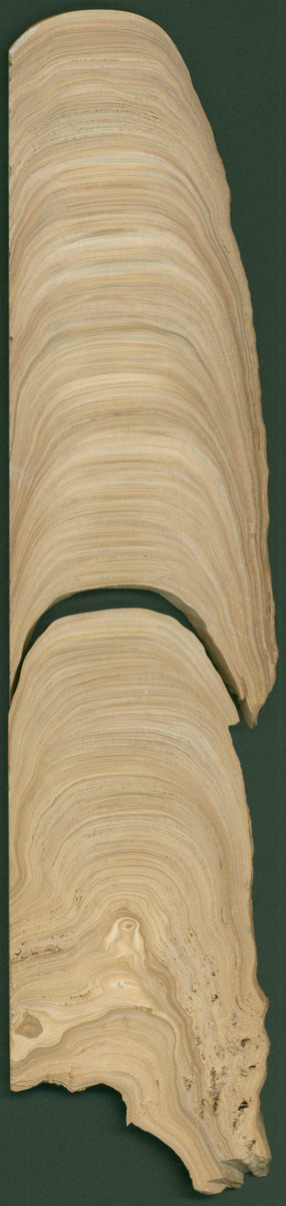
- limestone stalagmites likewise can record air temperatures, rainfall amounts and even the passage of tropical cyclones (Figure 5)
- corals record sea surface temperatures, ocean water salinity and the freshwater discharges of rivers.
Many of these are ‘proxy’ records, so they don't directly measure climate parameters such as temperature or rainfall. But they are usually calibrated against the instrumental record and as a consequence are regarded as reliable indicators of changes in climate over time.
T1I3_Figure-5.jpg
Box 2: Natural archives of climate
Climate records can be derived from natural archives. For example, limestone stalagmites archive the isotopic and geochemical signals contained in rainwater percolating through the cave roof and soil above the cave (Figure 5). Oxygen-18 and Carbon-13 are two isotopes commonly used to reconstruct past rainfall patterns - higher amounts of rain usually result in lower levels of Oxygen-18 and Carbon-13. Trace elements such as strontium and magnesium are also used to determine the relative moisture contents of the soil above the cave. Sharp drops in Oxygen-18 can reflect the passage of a tropical cyclone, as rainfall in these systems is often strongly depleted in Oxygen-18 compared to the more common Oxygen-16 (see Nott et al. 2007, Haig et al. 2014). These records can register the passage of individual cyclones and as a consequence changes in the frequency of these events over time can be assessed.
How have climates changed? Range of temperature changes. It doesn’t take much forcing to have a big effect.
Prior to the Quaternary, climate changes occurred over periods of tens of millions of years. The changes in climate during the Quaternary, which follow the timing of the orbital cycles, result from only slight variations in the energy from the Sun. During the last glacial, once snow and ice began to accumulate the albedo effect helped to promote further cooling and this assisted in the expansion of ice sheets across Western Europe and North America. Australia, however, was not covered in substantial quantities of ice as it is too far from the pole and also lacks high elevation landscapes.
The transition from interglacials to glacials occurs over approximately 80 000 years and follows a sawtooth pattern of climatic oscillations between warmer and progressively cooler stages. The change from glacials to interglacials is more rapid suggesting that, once the coldest part of the glacial period ends and warming begins, there are positive feedbacks that accelerate the process.
The cooler temperatures of the glacials resulted in substantial changes in vegetation coverage and types. For example, open woodlands largely replaced the rainforests of northeast Australia during the last glacial (20 000 years ago) until the beginning of the most recent interglacial (10 000 years ago) (Reeves et al. 2013).
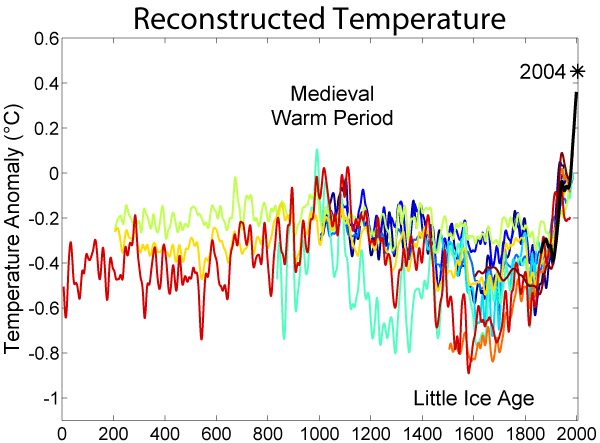
Climate over the past 2000 years
The last 2000 years contains the most detailed (highest resolution) records of Earth’s past climate. Proxy records of the El Niño-Southern Oscillation (ENSO) and the Interdecadal Pacific Oscillation (IPO) have been obtained from this time period. These natural climate oscillations have an important influence over Australia’s climate and anthropogenic climate change is likely to alter the nature of these climate states over future decades. These proxy records have been derived from corals, tree rings and stalagmites. Figure 6 shows a record of the Southern Oscillation Index, a measure of ENSO, derived from proxy records of rainfall across the Pacific and Indonesian regions. It highlights periods when El Niño and La Niña have dominated the climate for various periods of time.
T1I3_Figure-6.gif
How have sea levels changed?
The increase in ice storage on the Earth’s surface during glacials resulted in a lowering of sea levels by as much as 120 m during the Last Glacial Maximum 20 000 years ago (Murray-Wallace and Woodroffe 2014). This occurred because rivers didn’t return moisture evaporated from the oceans after it was precipitated as snow and rainfall (which became ice) across the landmasses of the northern hemisphere.
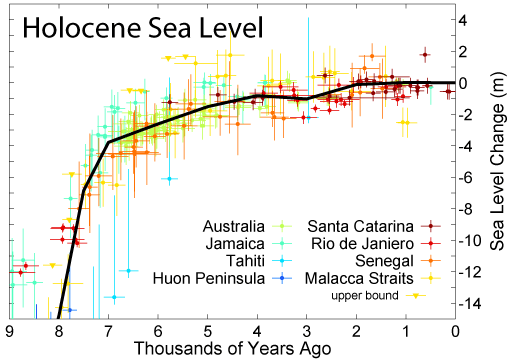
The warming climate after 20 000 years ago melted the ice and returned the water to the sea, sometimes as dramatic meltwater pulses after ice-dammed lakes burst. Sea levels rose by as much as 45 mm per year and on average 10 mm per year between approximately 18 000 years ago and about 7 to 8000 years ago. The increased weight of the water onto the now submerged continental shelves resulted in a relative raising of the coast around Australia by as much as 1 to 3 m resulting in a relative sea-level fall (hydro-isostasy – see Box 3) after approximately 7000 years ago (Figure 7). It is still uncertain if this fall was smooth and progressive or was interrupted by stages of relative sea-level stability or possibly small sea-level rises. This sea-level fall ended approximately 2-3000 years ago (Lewis et al. 2013).
T1I3_Figure 7.png
Box 3: Isostasy and hydro-isostasy
Isostasy is the state of gravitational equilibrium between the Earth’s crust and the mantle below. When a load is placed on the crust it is depressed and this is compensated by the relative uplift of the crust in surrounding regions. During the glacial periods ice sheets loaded the Earth’s crust and neighbouring terrain was uplifted. When the ice melted the uplifted land subsided and the depressed land formerly under the ice rebounded slowly upwards. Hydro-isostasy occurs during sea-level rise when seawater floods onto the continental shelves following the melting of the ice sheets (eustatic rise in sea level) and this depresses the sea floor and the adjacent land along the new coast rises resulting in a relative fall in sea level.
Source material
Haig J., J. Nott., and G. Reichart, 2014: Australian tropical cyclone activity lower than at any time over the past 550–1,500 years. Nature, 505, 667-671.
Lewis S.E., C.R. Sloss, C.V. Murray-Wallace, and C.D. Woodroffe, 2013: Post-glacial sea-level changes around the Australian margin: a review. Quaternary Science Reviews, 74, 115-138.
Miller, K.G., and Coauthors, 2005: The Phanerozoic record of global sea-level change. Science, 310, 1293-1298.
Murray-Wallace, C., and C. Woodroffe, 2014: Quaternary Sea-level Changes, Cambridge University Press, 504 pp.
Nott, J., J. Haig, H. Neil, and D. Gillieson, 2007: Greater frequency variability of landfalling tropical cyclones at centennial compared to seasonal and decadal scales. Geophysical Research Letters, 25, 367-372.
Reeves J.M., and Coauthors, 2013: Climate variability over the last 35,000 years recorded in marine and terrestrial archives in the Australian region: an OZ-INTIMATE compilation. Quaternary Science Reviews, 74, 21-34.
Williams, M., D. Dunkerley, P. De Deckker, A. Kershaw, and T. Stokes, 1993: Quaternary Environments. Edward Arnold Publishers, 329 pp.
Yan, H., L. Sun, Y. Wang, W. Huang, S. Qiu, and C. Yang, 2011: A record of the Southern Oscillation Index for the past 2,000 years from precipitation proxies. Nature Geoscience, 4, 611-614.
Zachos, J., M. Pagani, L. Sloan, E. Thomas, and K. Billups, 2001: Trends, rhythms and aberrations in global climate 65 Ma to present. Science, 292, 686 – 693.
