You are here
Australia's climate - drivers, variability and extremes
Australia's climate is very variable from year to year and place to place, linked to changes in large-scale circulation systems such as El Niño.
At a glance
- As the sixth largest country in the world, spanning 35 degrees of latitude and with 35,000 km of coastline, Australia has a wide range of climates, ranging from wet monsoonal tropical in the North to temperate with four distinct seasons in the south.
- On average, rainfall is low, with more than 80% of the continent having an annual rainfall of less than 600 mm.
- Climates are variable and prone to extremes—droughts, heatwaves, fires, intense rainfall and floods. Key drivers of variability include the El Niño-Southern Oscillation (ENSO), the Indian Ocean Dipole, the Australian monsoon and the Southern Annular Mode.
- These extremes can have a significant impact on communities, natural environments and regional economies; for many decisions, an understanding of extremes is more important than an understanding of average climate.
Main text
Australia’s climate
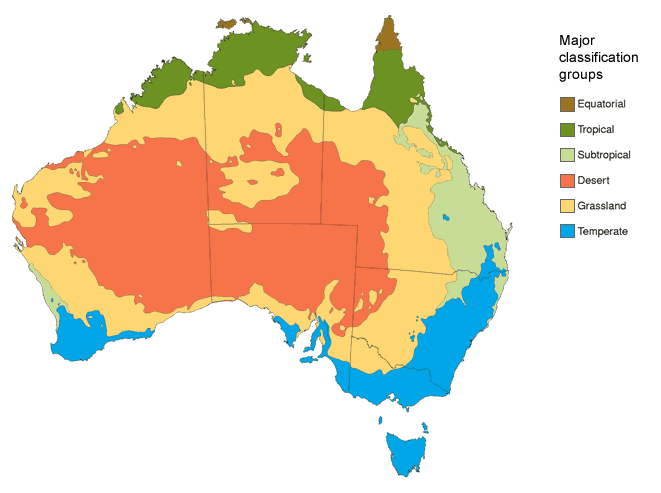
Australia is a large continent that spans 35° of latitude and hence experiences a range of climates. The north has a tropical climate, central Australia has a desert climate, and southern Australia has a temperate climate. Figure 1 shows six major climatic zones over Australia.
T1I1_Figure 1.gif

Tropical climates include the equatorial and sub-tropical regions in Figure 1 and are found in the north and north-east of Australia. In these regions there are distinct wet and dry seasons, each lasting about six months. The wet season, which occurs from November to March, is known as the Monsoon season in the Tropics, and is hot (maximum temperatures often above 30oC, and higher inland) and humid. Heavy rainfall in this season often causes flooding. In contrast the dry season between April and October is cooler, with average temperatures a little over 20oC, and drier.
Temperate climates span the coastal hinterland of New South Wales, much of Victoria, Tasmania, the south-eastern corner of South Australia and the south-west of Western Australia. In this region, there are four distinct seasons with a more marked temperature contrast between summer and winter.
As a whole, Australia has a relatively low rainfall. More than 80% of the continent has an annual average rainfall of less than 600 mm, although in the Wet Tropics this figure can rise to 1,200 - 8,000 mm.
Detailed information on Australia’s climate can be found on the Bureau of Meteorology website at http://www.bom.gov.au/climate/ (accessed 15 March 2016).
Australia’s climate can vary greatly from one year to the next, driven by changes in the large-scale atmospheric circulation (see next section), and this in turn can lead to extreme events such as droughts, heatwaves, fires, intense rainfall and floods . For many parts of Australia, the frequency and intensity of extreme weather events is an important characteristic of climate for planning and decision-making.
Drivers of Australia’s climate
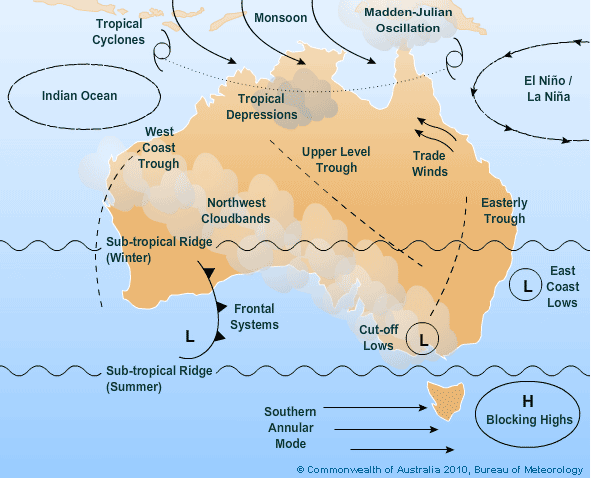
A number of large-scale features in the global climate system affect Australia’s climate (see Figure 2). These include:
- El Niño-Southern Oscillation (ENSO)
- the Indian Ocean Dipole
- the Australian monsoon and the Madden-Julian Oscillation
- the Southern Annular Mode.
These drivers affect the weather, especially rainfall, in Australia over different regions and seasons.
T1I1_Figure-2.gif

El Niño-Southern Oscillation (ENSO): The winds over the Pacific Ocean close to the Equator typically blow from east to west (and their strength is measured by the Southern Oscillation Index, or SOI). When this typical pattern is disrupted, and the winds weaken or even reverse, we describe the event as an El Niño. An El Niño generally brings drier conditions and warmer temperatures to much of eastern Australia, and if prolonged, can lead to drought. El Niño events generally occur every two to seven years.
During a La Niña, the typical easterly winds across the Pacific are strengthened, bringing above average rainfall to much of Australia, and sometimes flooding. For example, 2010 and 2011, the wettest two year period on record, were dominated by strong La Niña conditions and damaging floods occurred in several areas in Queensland.
For more information, see some of the BoM resources on ENSO:
- www.bom.gov.au/climate/enso/history/ln-2010-12/three-phases-of-ENSO.shtml (accessed 15 March 2016).
- http://www.bom.gov.au/climate/enso/images/El-Nino-in-Australia.pdf (accessed 15 March 2016).
- www.youtube.com/watch?list=PLbKuJrA7Vp7naJL31deES8QAV5E0q6U_H&v=dzat16LMtQk (accessed 29 May 2018).
The Indian Ocean Dipole (IOD) is a measure of the difference in sea surface temperature in the western and eastern equatorial Indian Ocean. When positive, there is cooler than normal water in the tropical eastern Indian Ocean and warmer than normal water in the tropical western Indian Ocean. This pattern is associated with lower rainfall over parts of central and southern Australia. A negative IOD pattern is associated with an increase in rainfall over parts of southern Australia.
In northern regions, the Australian monsoon is a key driver of the tropical dry and wet seasons. The dry season is characterised by southeast trade winds (dry because of their passage over the continent) and the wet season by moisture-laden northwest monsoonal winds. During the wet season, the monsoon can be in either an active or an inactive phase. The transition from active to inactive may be associated with the Madden-Julian Oscillation, an eastward movement of large regions of higher and lower tropical rainfall. The MJO operates on time scales of 30-60 days.
Southern Australia is affected by a large-scale circulation feature known as the sub-tropical ridge. This is a belt of high pressure that encircles the globe in the middle latitudes. In the warmer months the ridge is positioned to the south and is associated with stable high pressures and drier climates over southern Australia. During cooler months the ridge moves northwards towards the equator, allowing more rain-bearing cold fronts to cross southern Australia.
The Southern Annular Mode (SAM) describes the north-south movement of the westerly wind belt that circles Antarctica. In the positive phase:
- the band of westerly winds contracts toward Antarctica
- there are higher pressures over southern Australia that can bring stable, dry conditions.
In the negative phase:
- the band of westerly winds expands towards the Equator
- there are more (or stronger) low pressure systems over southern Australia that can bring increased storms and rain.
The Victorian Government has developed entertaining and informative videos about these key climate drivers using sheep-dogs: Enso (El Niño-Southern Oscillation), Indy (Indian Ocean dipole), Ridgy (sub-tropical ridge), Sam (The Southern Annular Mode) and Mojo (Madden-Julian Oscillation). These videos can be seen at http://agriculture.vic.gov.au/agriculture/weather-and-climate/understanding-weather-and-climate/climatedogs (accessed 29 May 2018).
A climate of frequent extremes
Over the last 120 years Australia has experienced three major droughts:
- the ‘Federation drought’ (1895-1903)
- the ‘World War II drought’ (1939-1945)
- the ‘Millennium drought’ (1996-2010).
These droughts have been related to variability of large-scale drivers such as El Niño and the IOD. ENSO is the dominant driver of rainfall extremes in Australia, both positive and negative. The period 2010 – 2013 saw widespread, individual very heavy rainfall events in eastern Australia associated with a La Niña.
The number of tropical cyclones making landfall in Australia is strongly influenced by ENSO, with more tropical cyclones during La Niña years and fewer in El Niño years. On average, around 11 tropical cyclones affect the Australian continent each year, generally between November and April. Severe tropical cyclones are characterised by catastrophic wind gust speeds, storm surges, extreme rainfall and flooding. You can find more information on Impacts of cyclones and wind storms.
Further south along the east coast, East Coast Lows can bring large ocean waves and heavy rainfall to coastal regions. These have caused some of the most damaging natural disasters in Australia’s history due to the extreme winds, waves and rainfall, resulting in flooding. However, they provide benefits by replenishing water resources.
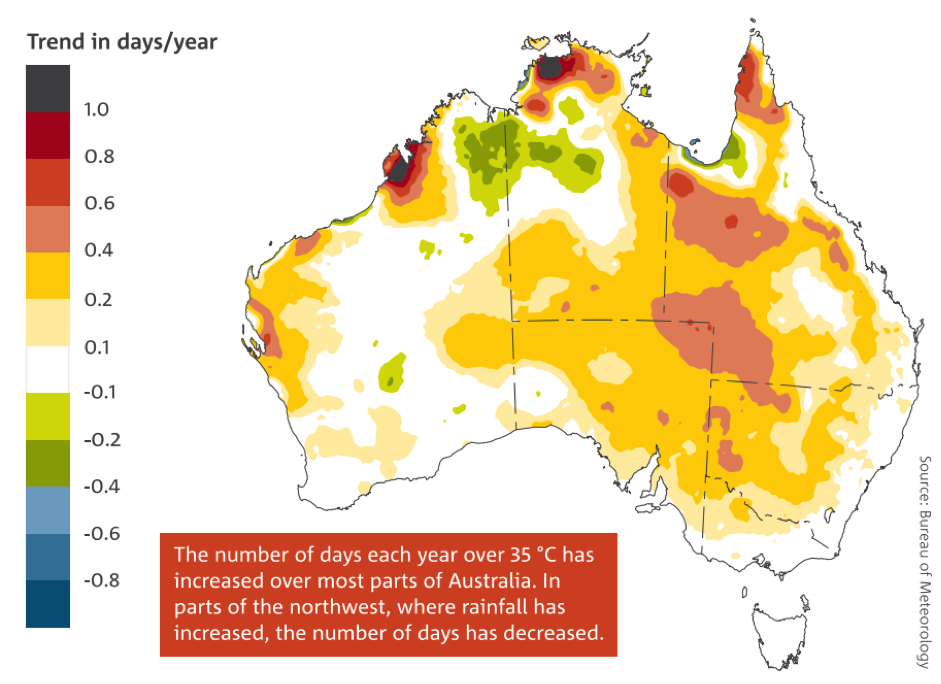
Australia has frequent hot days and heatwaves and these are increasing in frequency and severity as a result of global warming (See our page on Observed climate and sea-level change). Figure 3 shows trends in days above 35°C across Australia.
T1I1_Figure_3.png

Australia is one of the most bushfire prone countries in the world. On average, there are more than 50,000 bushfires in Australia each year. The Australian climate is generally hot, dry and prone to drought and, in the southeast, occasional strong winds often associated with summer cold fronts can lead to extreme fire danger. The seasons in which fires typically occur vary across the Australian continent: fires in northern Australia occur during the dry season in winter and spring, while in the southeast and southwest the fire season is in the hot dry summer and autumn.
A number of these extremes have become more frequent or intense in recent decades, some most likely in response to climate change. The Intergovernmental Panel on Climate Change (IPCC) identified an increased frequency and intensity of heatwaves and extreme fire risk days in recent decades over Australia (Reisinger et al. 2014). Information and records of a number of weather and climate extremes can be found on the Bureau of Meteorology website, http://www.bom.gov.au/climate/change/about/extremes.shtml (accessed 15 March 2016)
Further information
Bureau of Meteorology, information on climate extremes.
http://www.bom.gov.au/climate/extremes/ (accessed 15 March 2016)
Source material
CSIRO and Bureau of Meteorology, 2015: Climate Change in Australia Information for Australia’s Natural Resource Management Regions: Technical Report, CSIRO and Bureau of Meteorology, Australia. Accessed 29 May 2018 [Available online at https://www.climatechangeinaustralia.gov.au/en/publications-library/technical-report/]
Reisinger, A., R.L. Kitching, F. Chiew, L. Hughes, P.C.D. Newton, S.S. Schuster, A. Tait, and P. Whetton, 2014: Australasia. In: Climate Change 2014: Impacts, Adaptation, and Vulnerability. Part B: Regional Aspects. Contribution of Working Group II to the Fifth Assessment Report of the Intergovernmental Panel on Climate Change [Barros, V.R., C.B. Field, D.J. Dokken, M.D. Mastrandrea, K.J. Mach, T.E. Bilir, M. Chatterjee, K.L. Ebi, Y.O. Estrada, R.C. Genova, B. Girma, E.S. Kissel, A.N. Levy, S. MacCracken, P.R. Mastrandrea, and L.L. White (eds.)]. Cambridge University Press, Cambridge, United Kingdom and New York, NY, USA, pp. 1371-1438. Accessed 3 March 2016 [Available online at https://www.ipcc.ch/pdf/assessment-report/ar5/wg2/WGIIAR5-Chap25_FINAL.pdf]


