You are here
Tackling coastal erosion, a trillion measurements at a time
The City of Onkaparinga in South Australia has employed aerial photography and photogrammetric mapping to accurately measure rates of erosion and the impact of climate change and sea-level rise.
How do councils track the extent of coastal erosion and identify regions susceptible to collapse? The traditional way is to have staff undertake site inspections. However, that is not particularly scientific – and may even be dangerous. Areas that are difficult, or even impossible, to access may be rapidly changing.
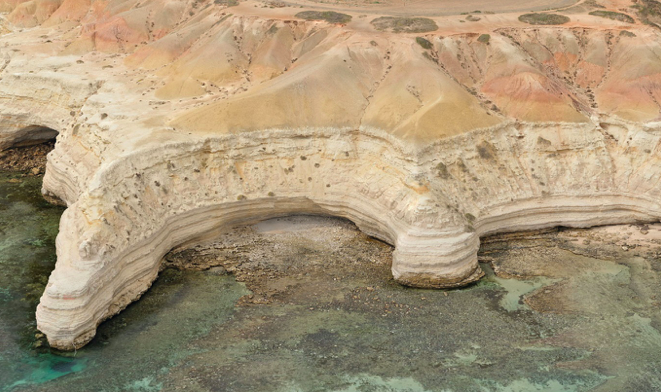
The City of Onkaparinga has 30 kilometres of coastline that is prone to erosion. The soft sedimentary rocks that form cliff faces have deep fissures, caves, arches and undercut areas. Access is difficult and, in some places, unsafe.
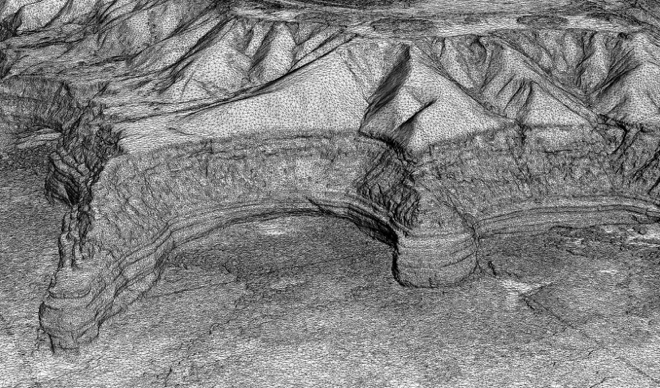
The City employed local company AEROmetrex to prepare detailed photogrammetric mapping. Photogrammetry is the science of making measurements from photographs. The invention of high-resolution digital cameras and powerful computers has led to new applications of an old technique.
‘We used a helicopter to capture 25,000 photographs and added 125 ground control points to generate a detailed 3D mesh accurate to 100 millimetres,’ says David Byrne, technical director at AEROmetrex. ‘The application of this technology to this problem is a world first as far as we know.’
Each photograph represents 36 million data points, so 25,000 photographs creates trillions of data points.
‘We need substantial computer resources to process all the data, but the approach works especially well on natural terrain surfaces,’ David says.
‘The ground control points help ensure that positioning is accurate, and the model is scaled and checked by GPS.’
Repeating the photography and modelling in future will accurately reveal volumes and rates of erosion and help identify any hazardous areas.
Watch 3D modelling of the Onkaparinga cliffs and adjacent areas at https://www.youtube.com/watch?v=xDjkY0InHwo
Are there any natural areas in your municipality that are subject to coastal erosion?
If so, how is this erosion being monitored?0s1ma18wqfp7kuwu.png
px0whfx9q1ck7kgl.png